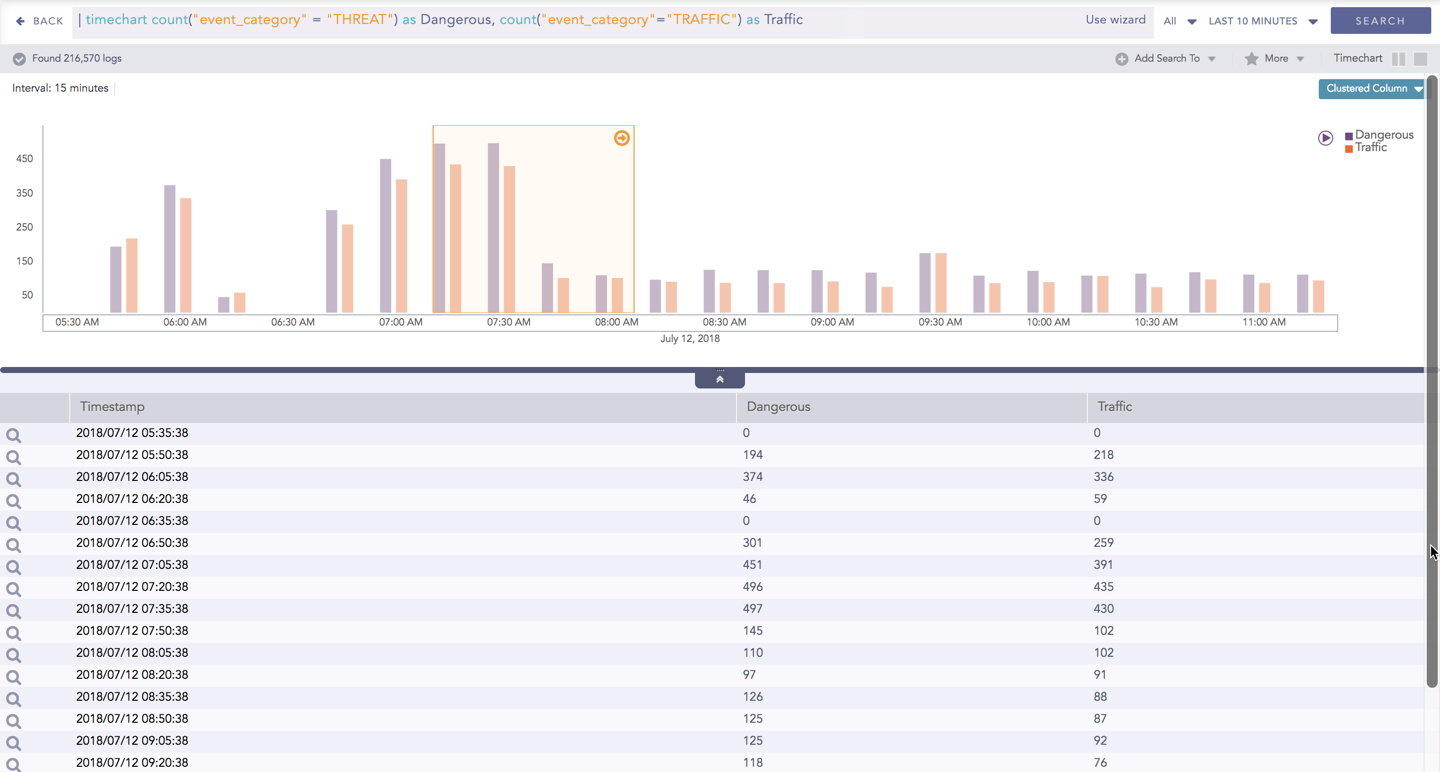
The Timechart Multiple Aggregation without Grouping response type is used for aggregation of processed logs related to the given parameters. The logs are grouped into time buckets (as a time series data) over a specified time-range.
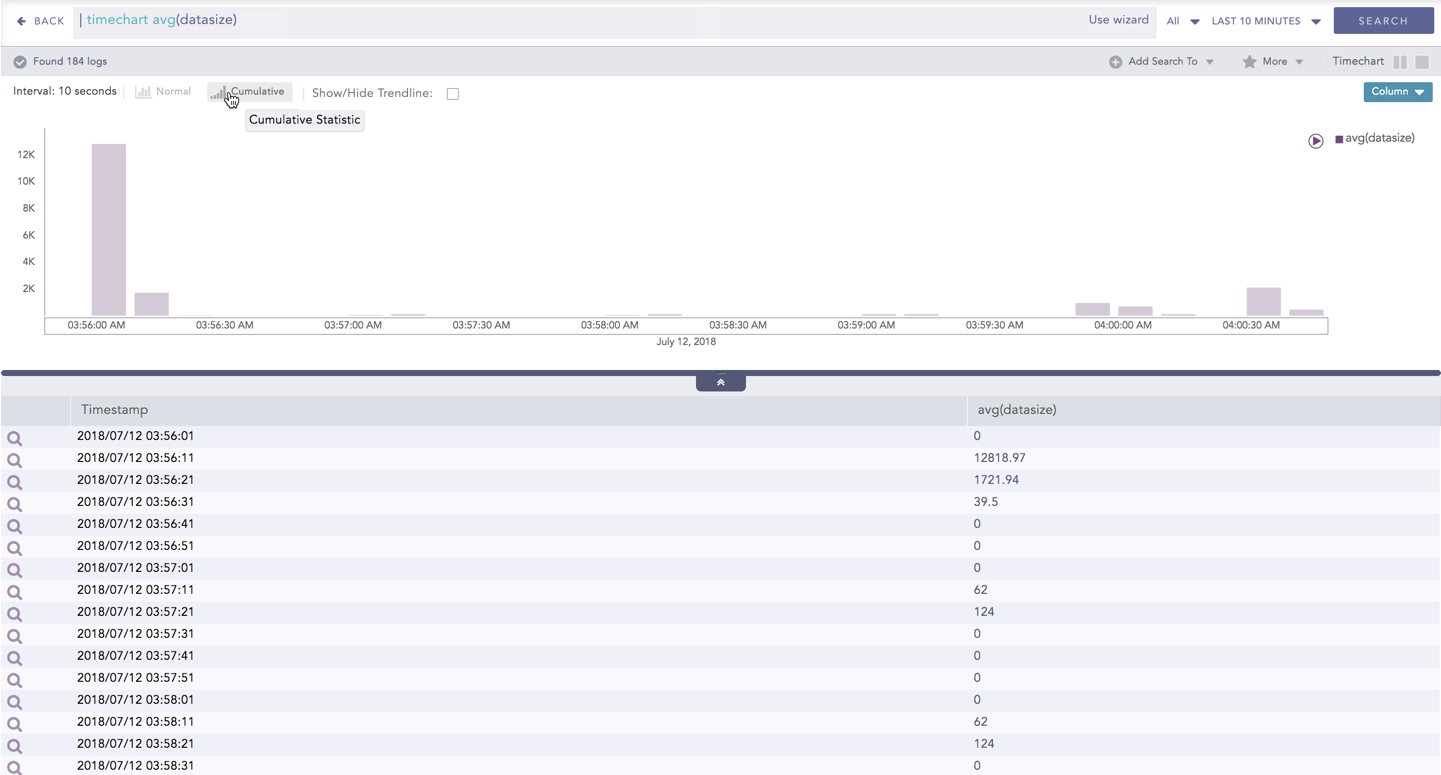
This query displays the count of total logs generated and the average datasize of collected logs for individual time bucket over a specified range of time. The result of this query can be represented in the form of :Clustered Column, Clustered Line, Radar, and Stacked Area charts.
General Operations of Timechart Multiple Aggregation without Grouping
This section contains the general operations that can be applied to all the charts belonging to the Timechart Multiple Aggregation without Grouping response type.
Note
Some charts might consist of operations that are relevant to the specific chart only. For such operations, refer to the section of the particular chart.
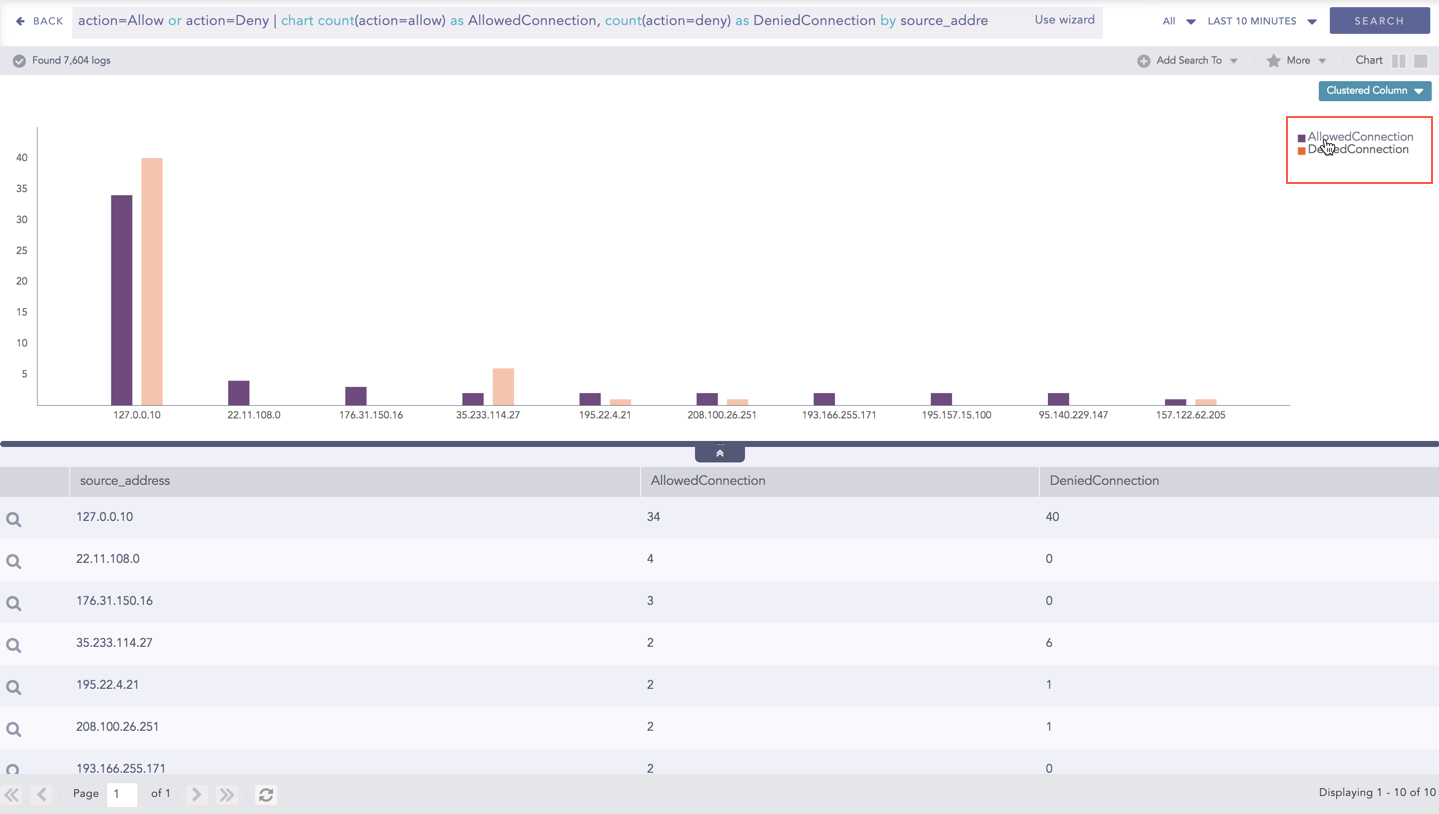
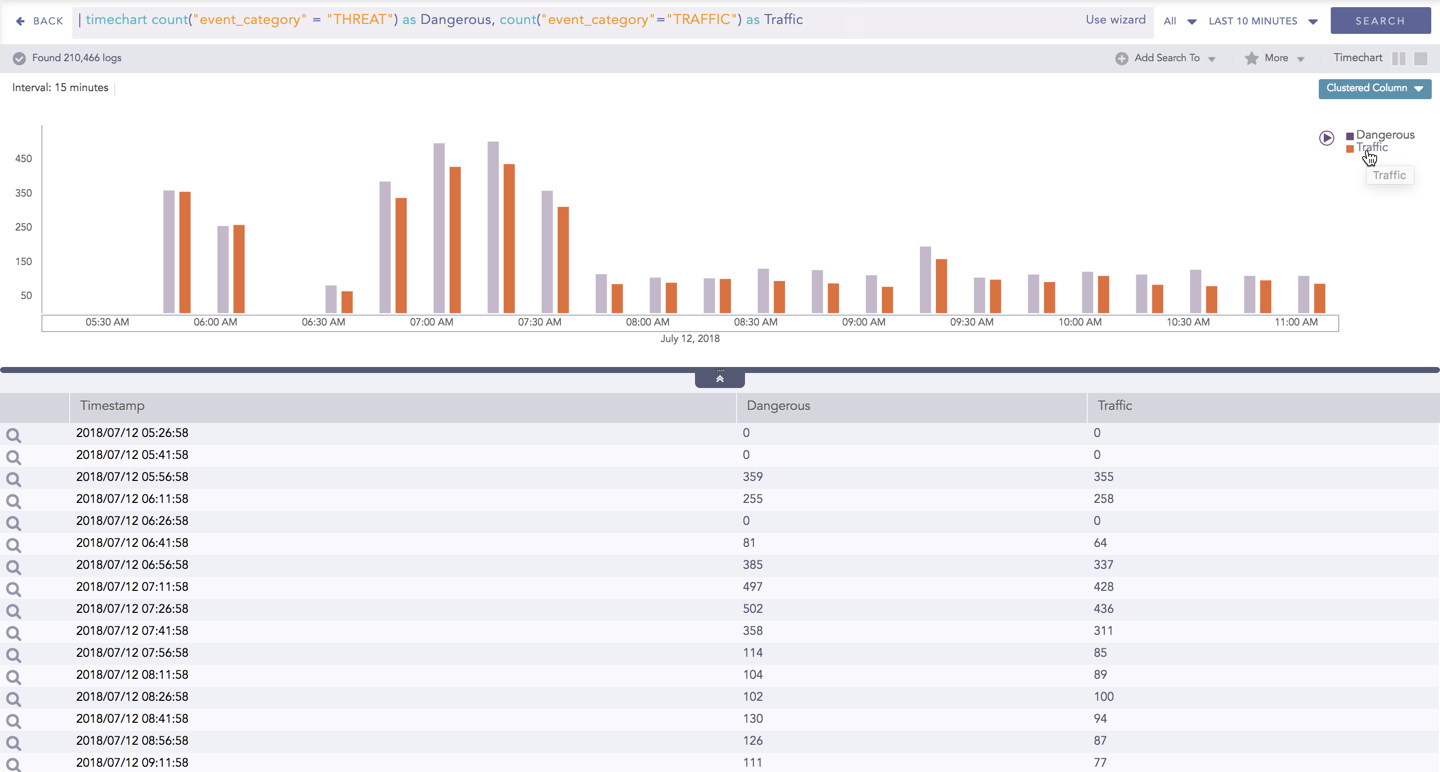
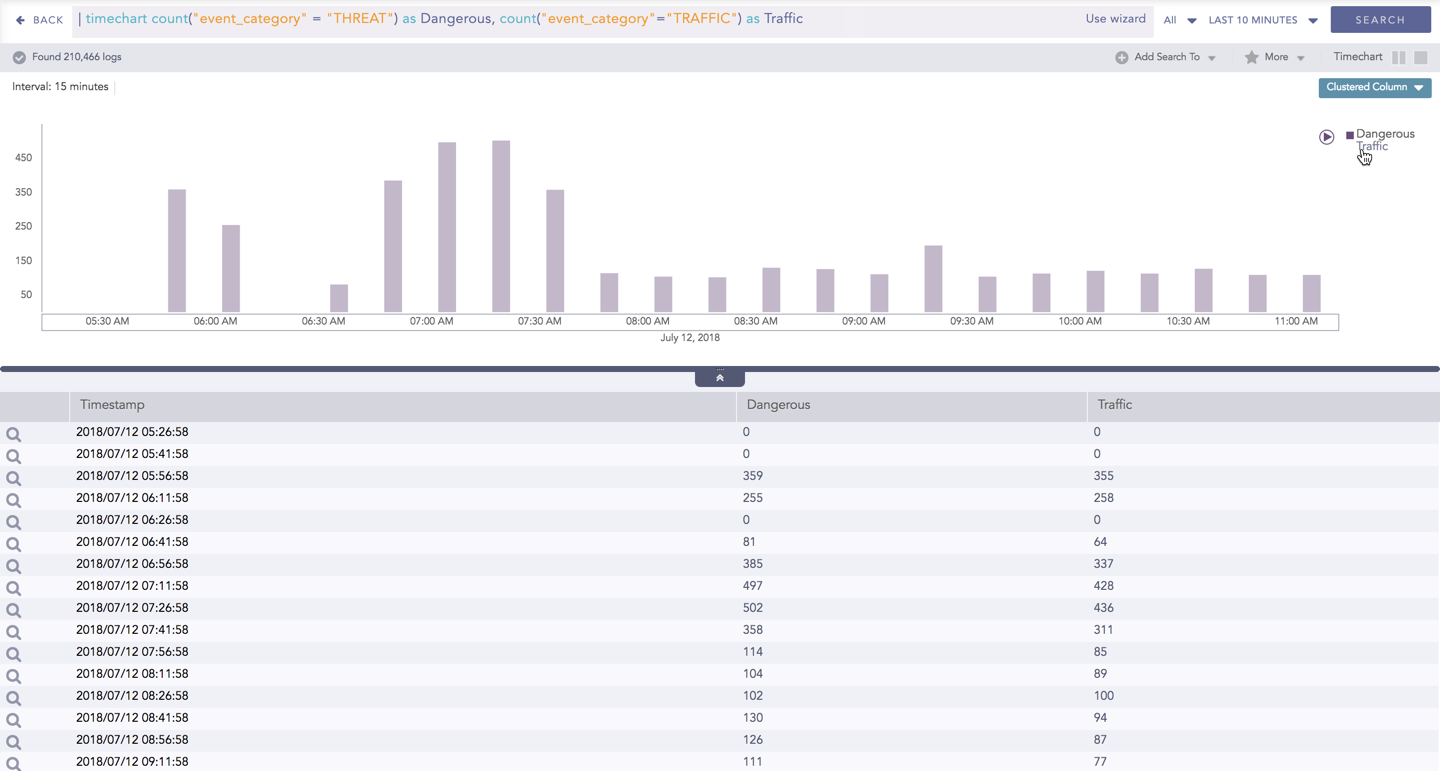
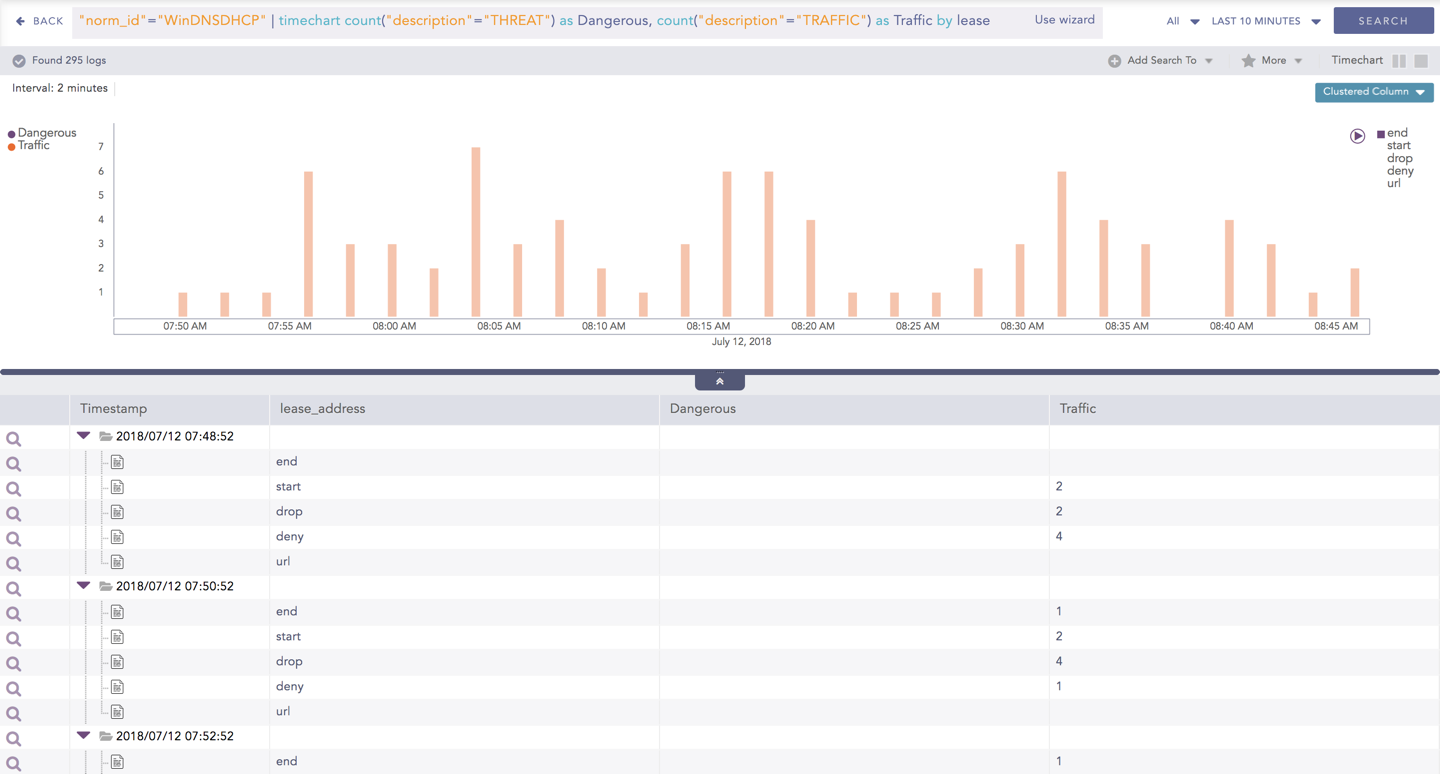
Interactive Legend
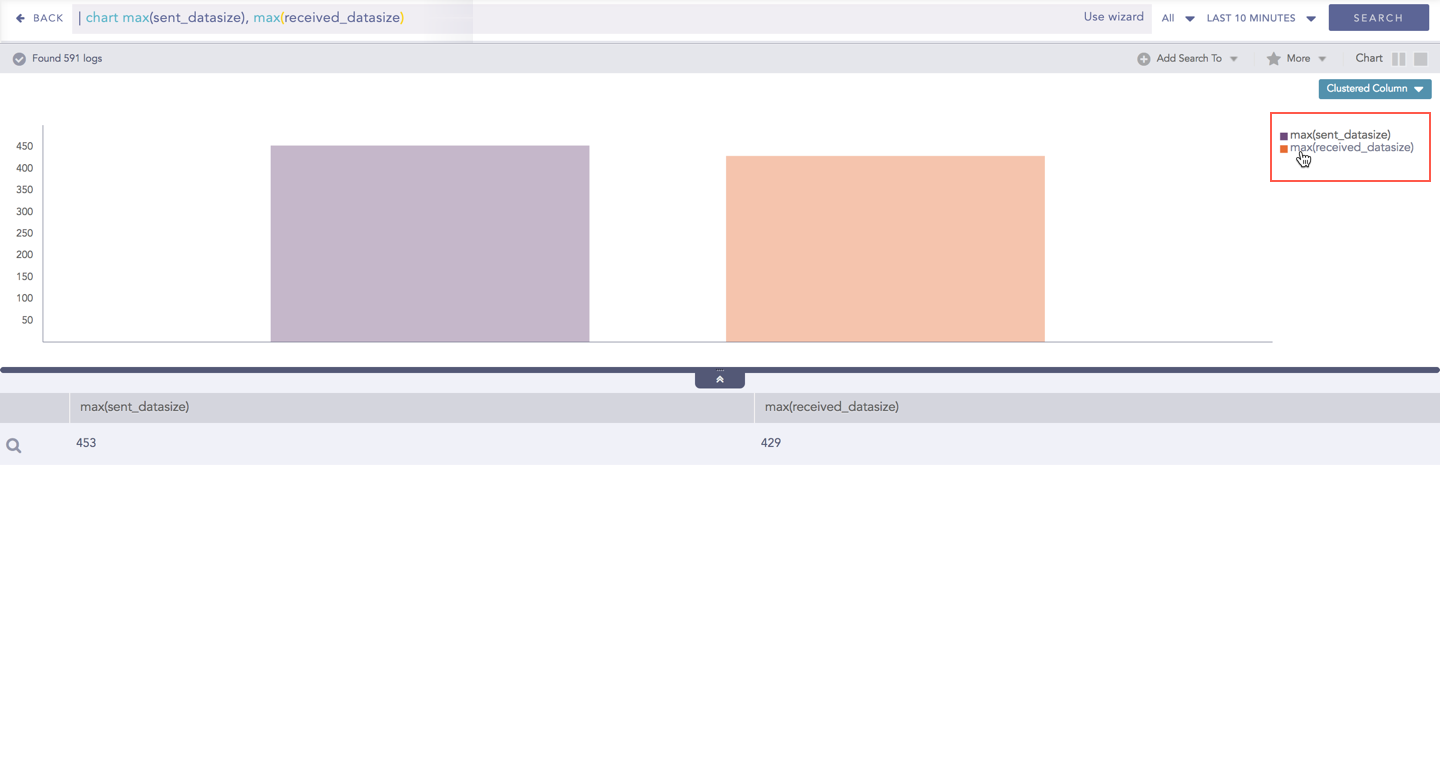
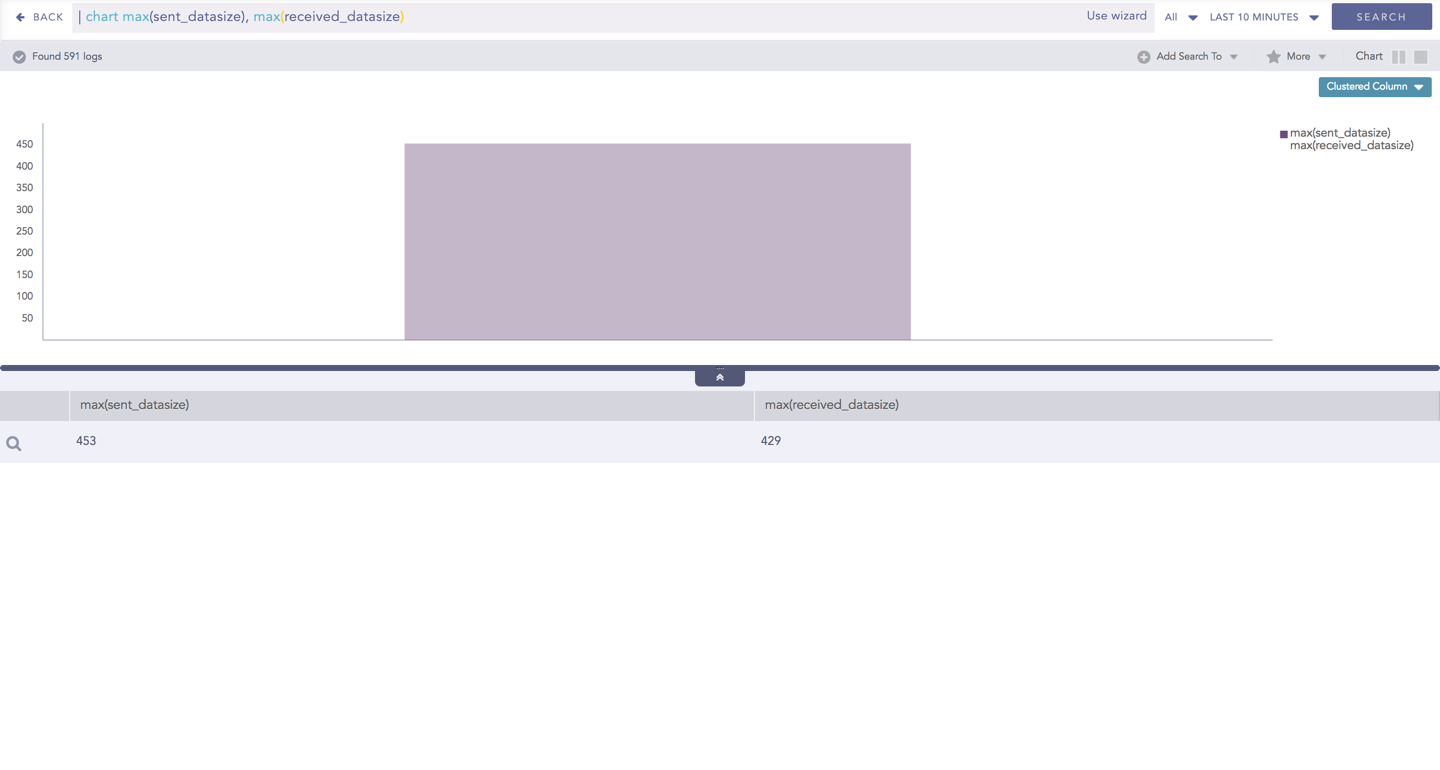
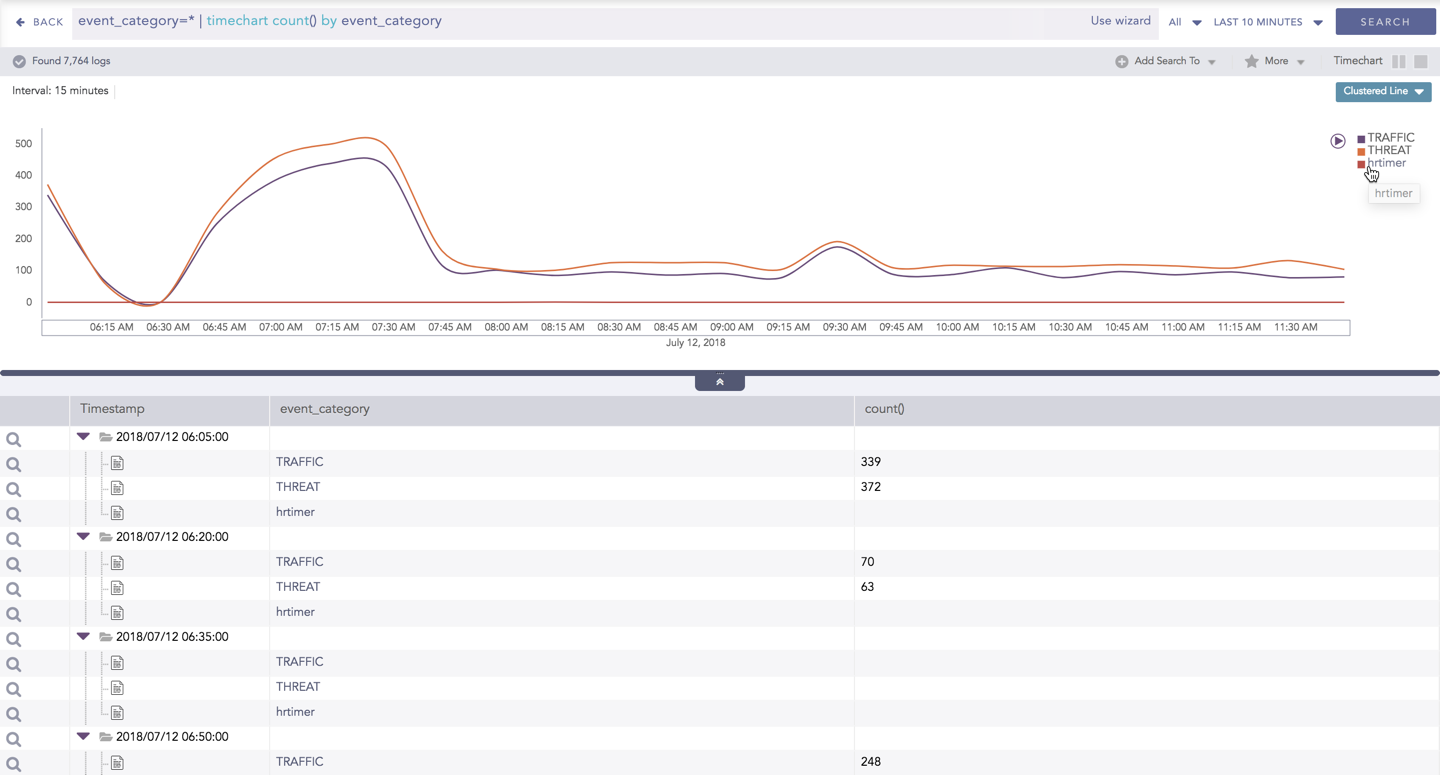
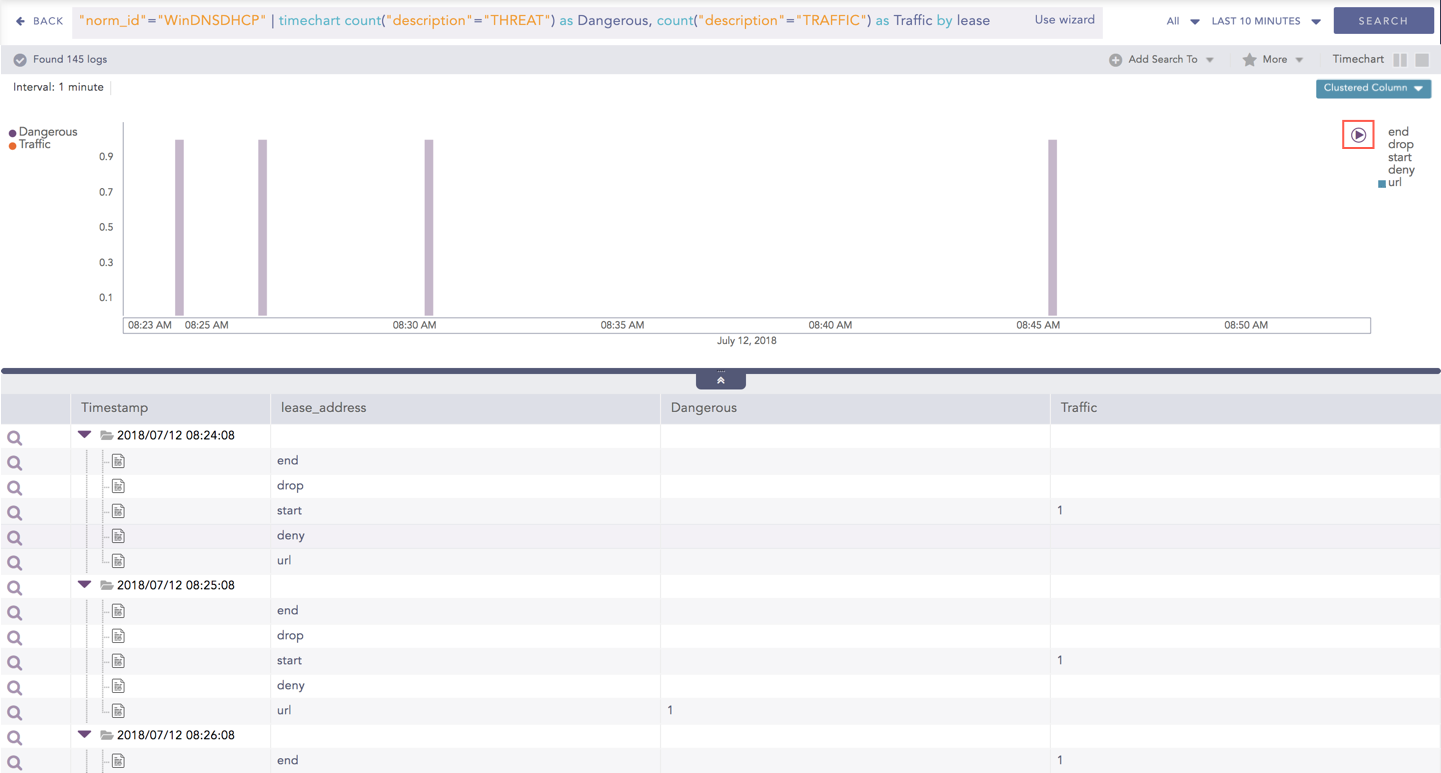
In the Timechart Multiple Aggregation without Grouping response type, when a chart is rendered, all the values of the selected aggregation parameter(s) are displayed with a unique color for each value of the aggregation parameter(s). However, you can view the graphs for specific aggregation parameter(s).
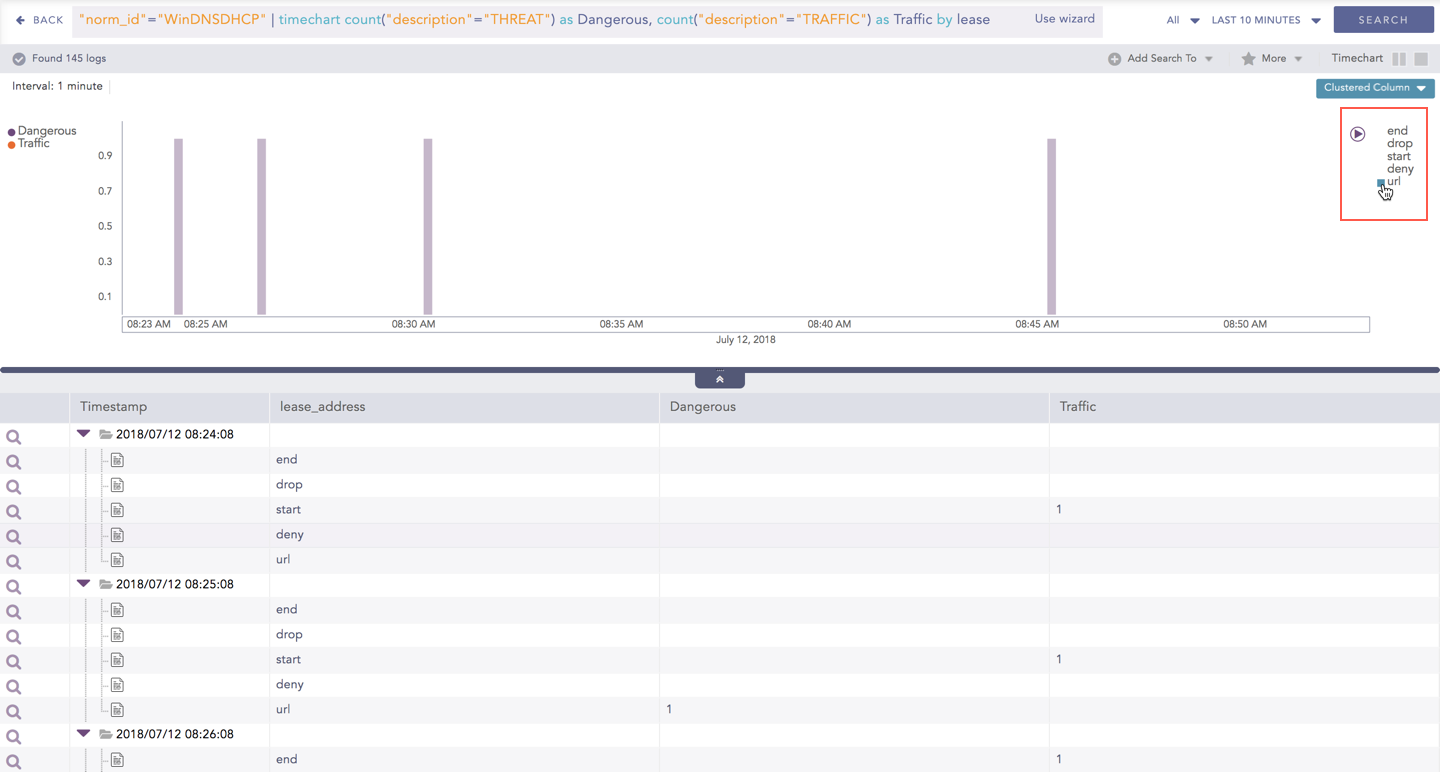
To hide an aggregation parameter, click the name of the parameter on the legend at the extreme right side of the container.
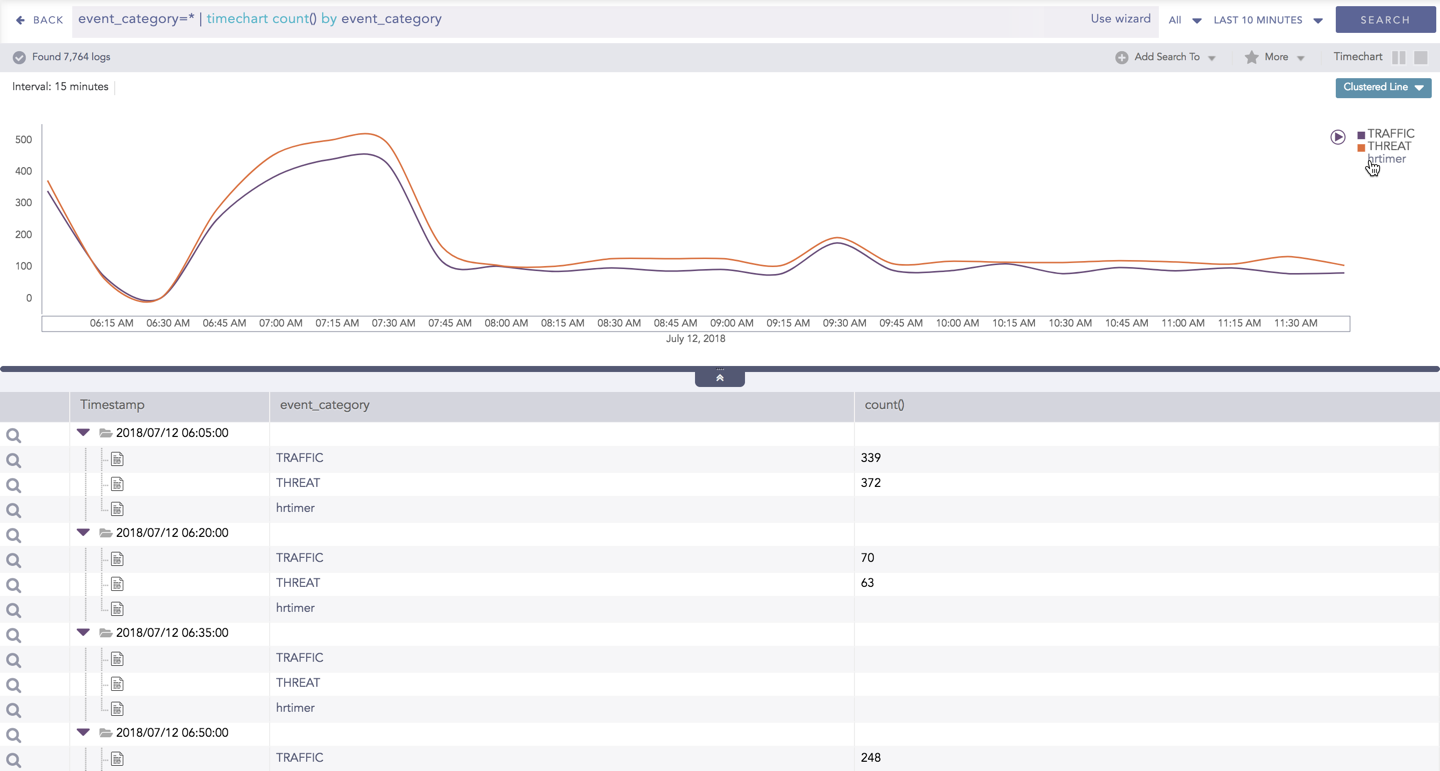
When you click a name of a parameter on the legend, the section (line, column, bar) referring to the respective parameter disappears, and a new chart is rendered consisting all other aggregation parameters (s). Click the legend again to unhide the value.
Note
The scale on the y-axis is auto-adjusted as per the value of the remaining aggregation parameter(s).
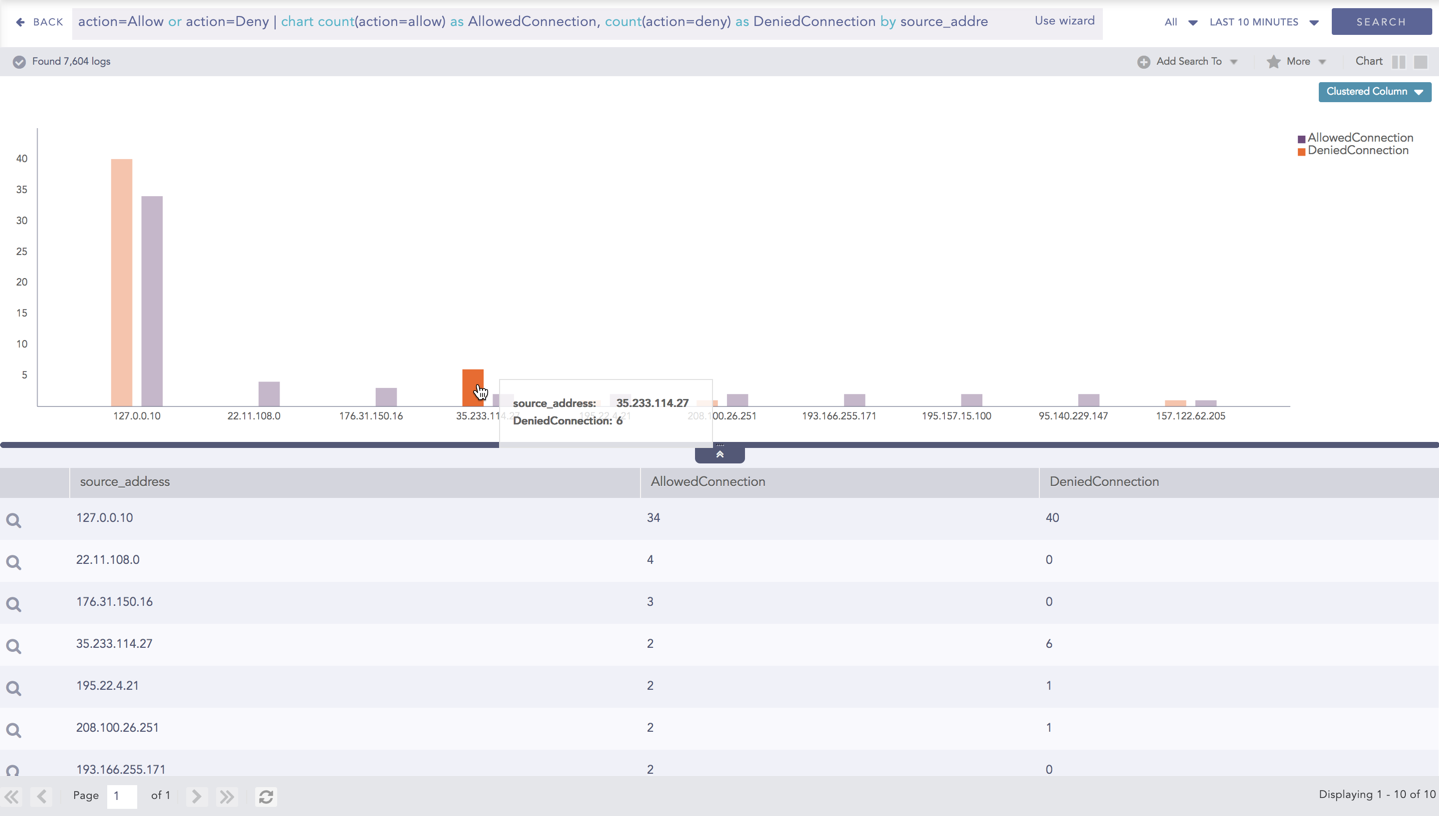
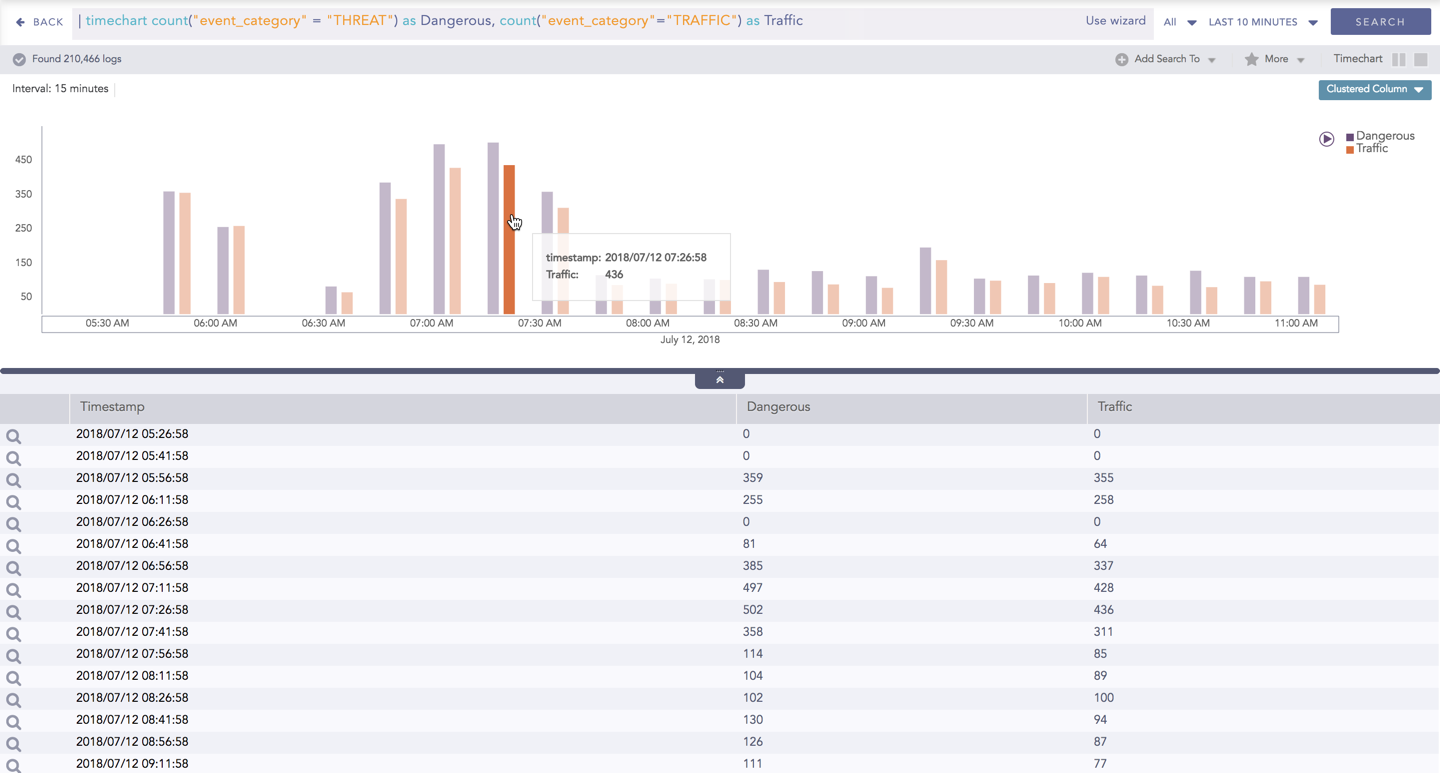
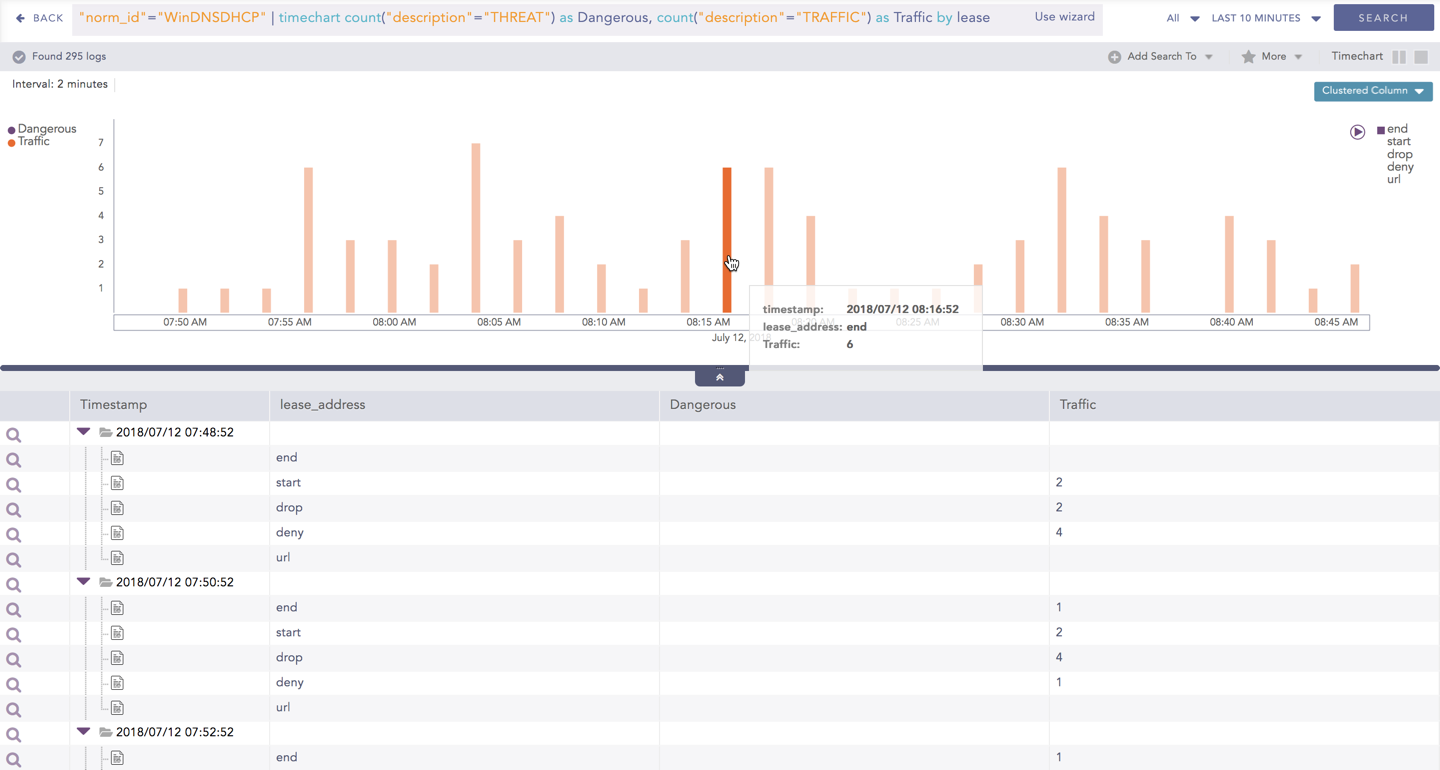
Drill-down
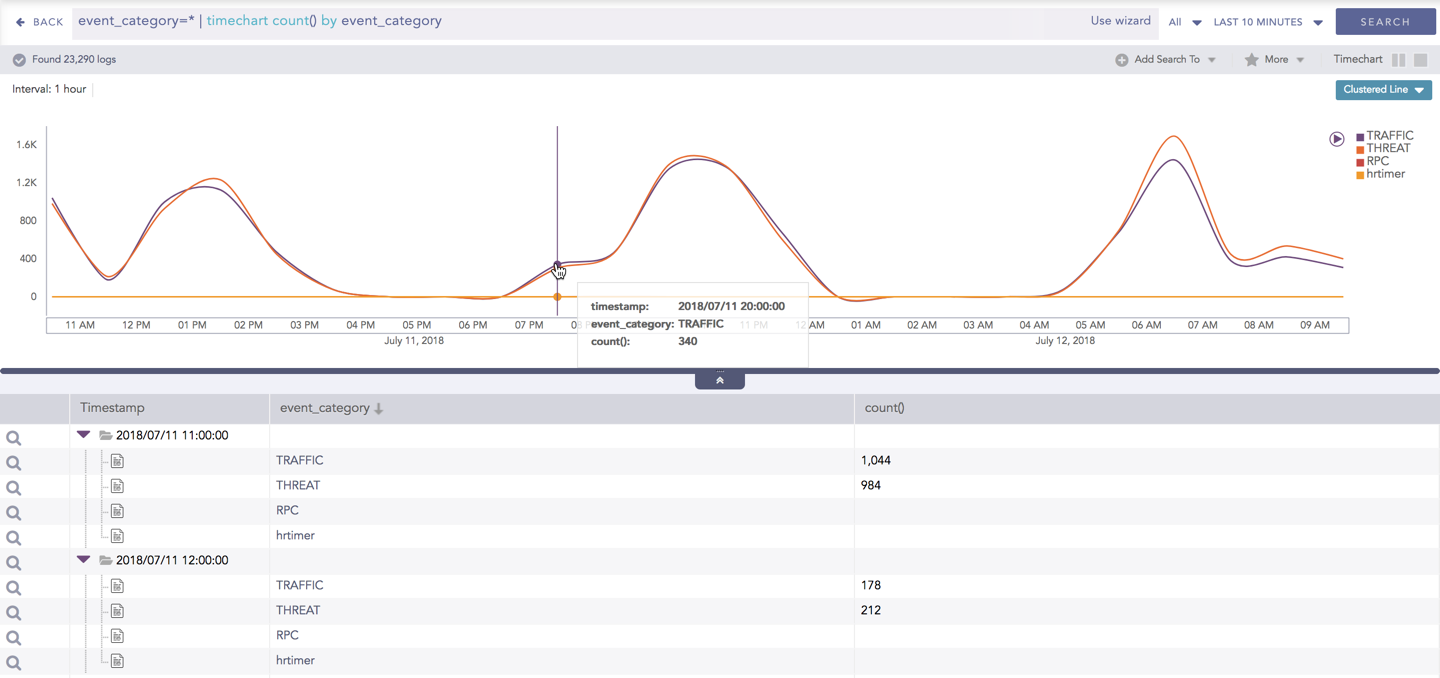
You can choose to view a detailed search for the response type regarding a specific value in two ways, i.e., from the line, or using a drag box.
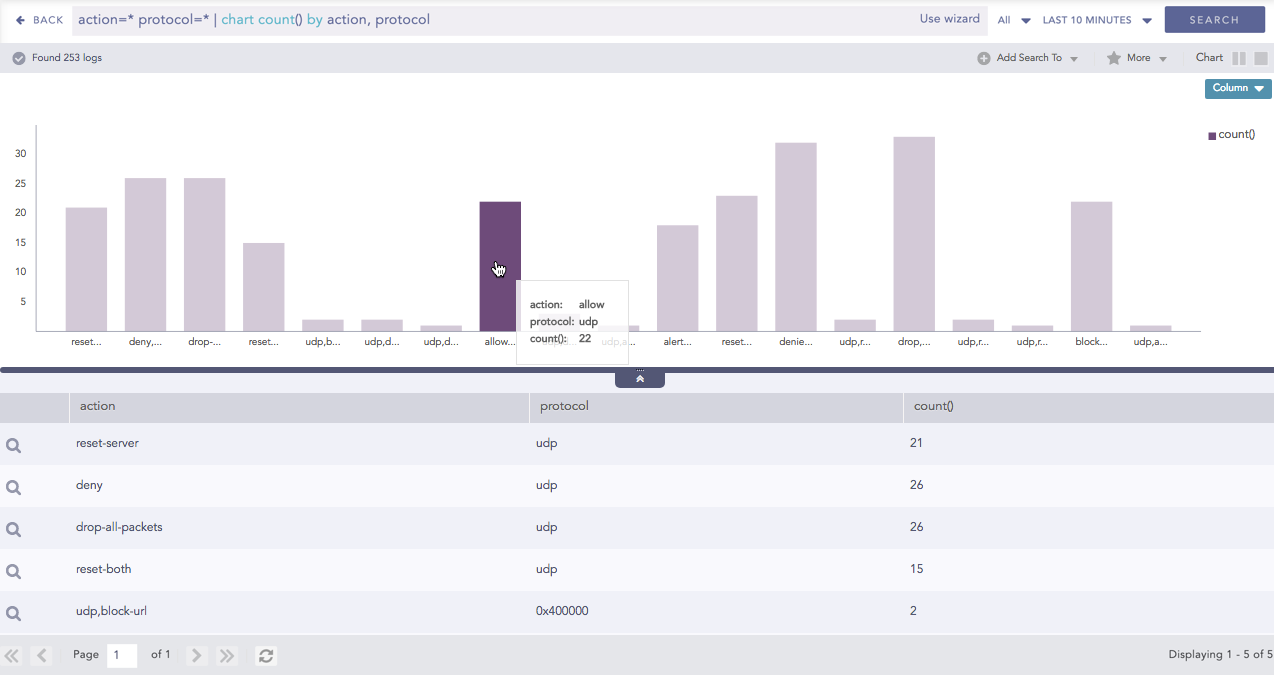
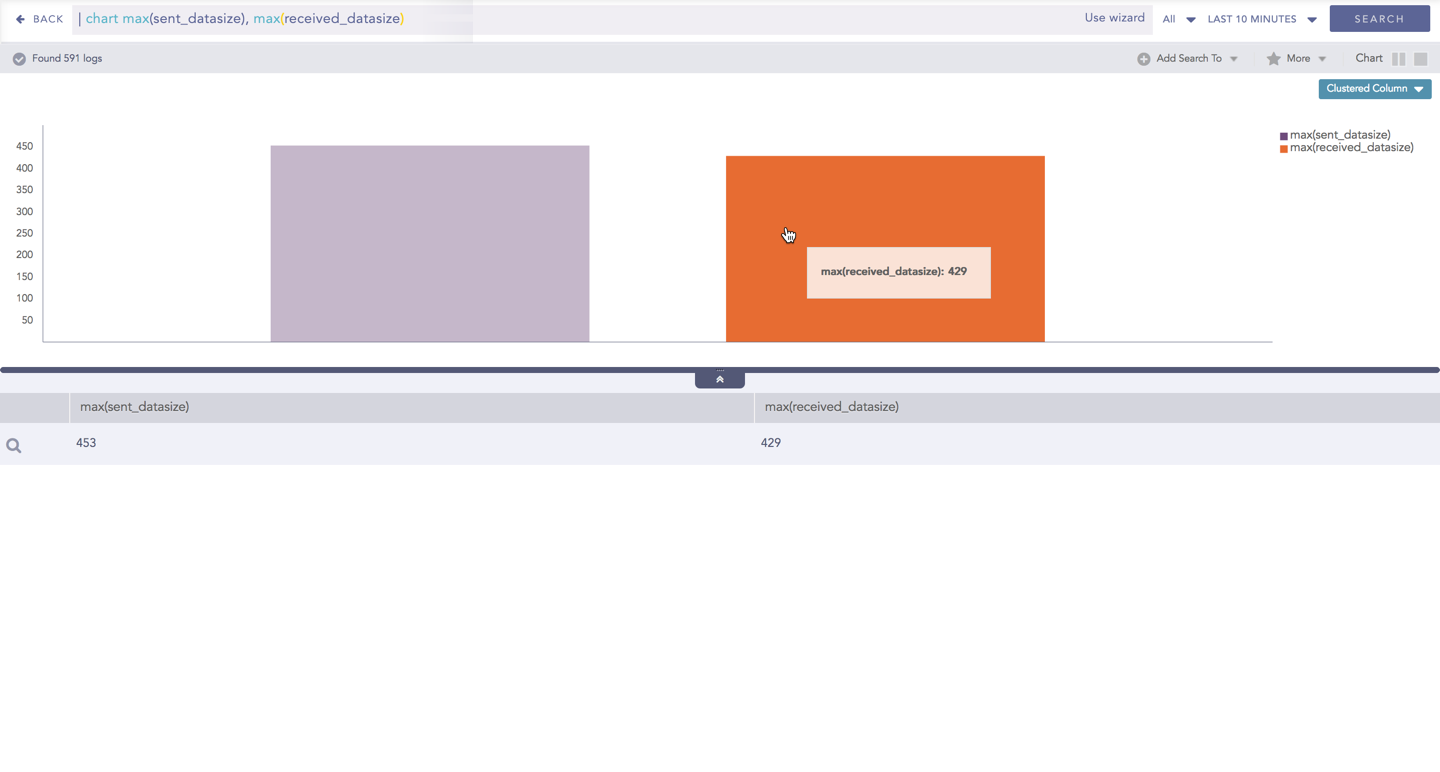
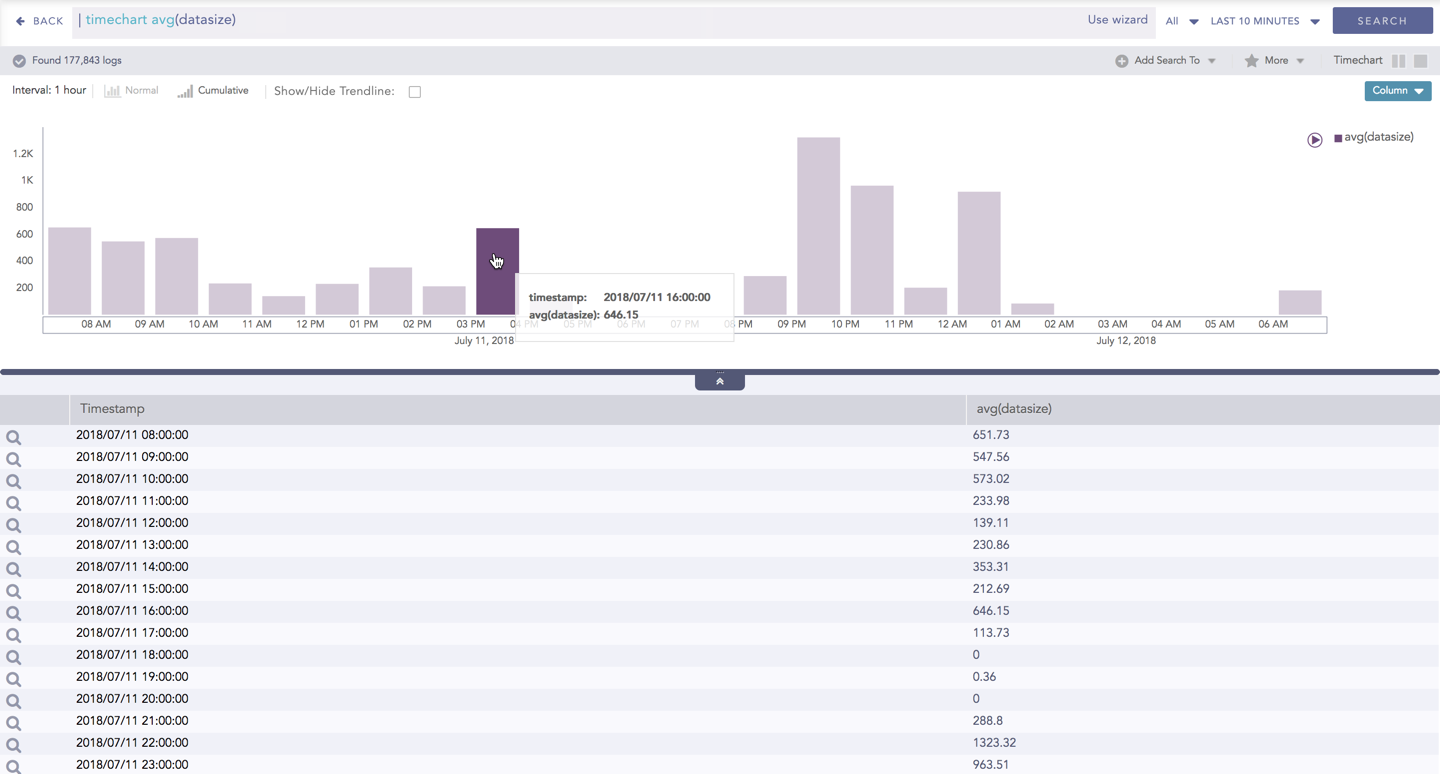
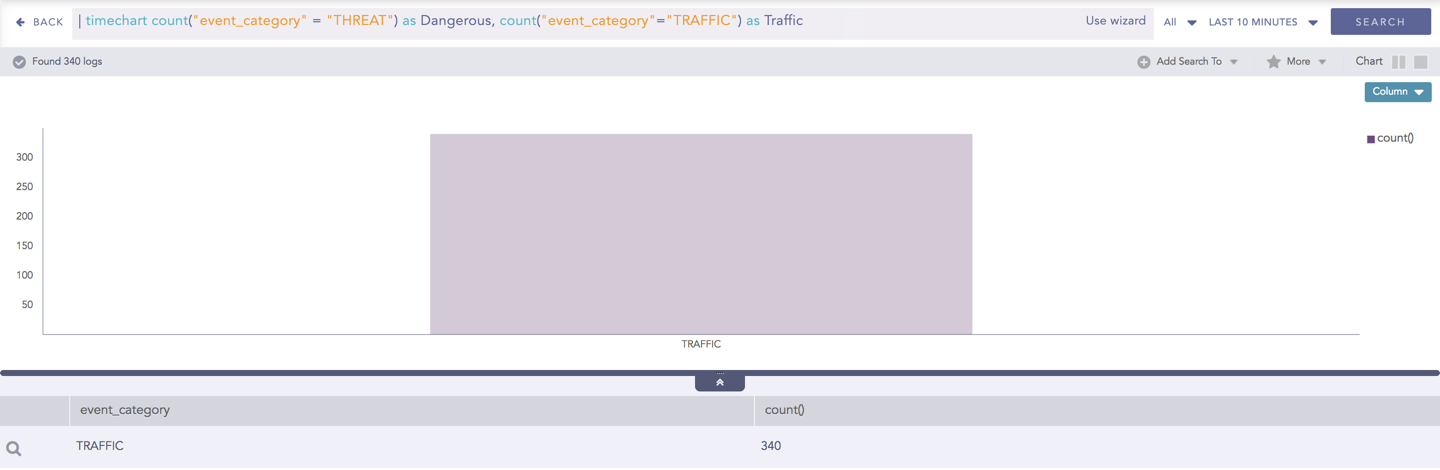
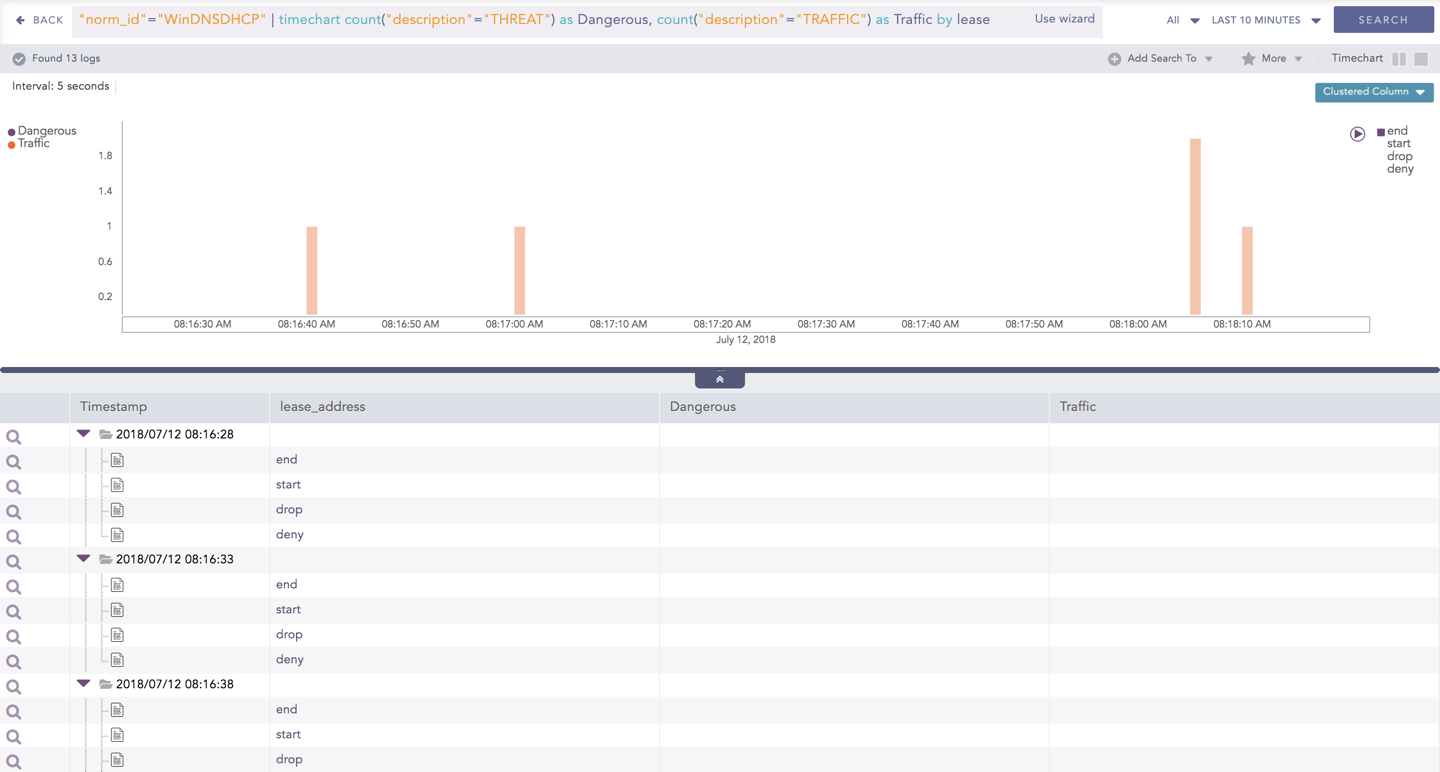
Hover over a specific component/area of a chart to view a tool-tip. The tooltip displays all the information about the particular node.
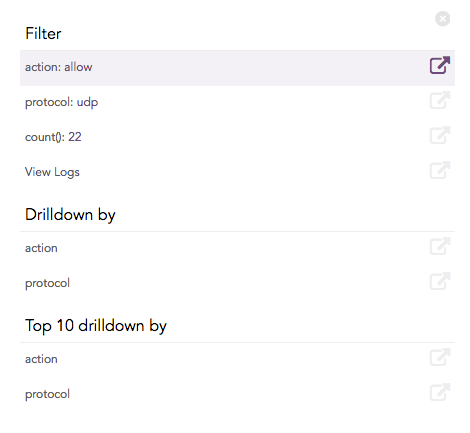
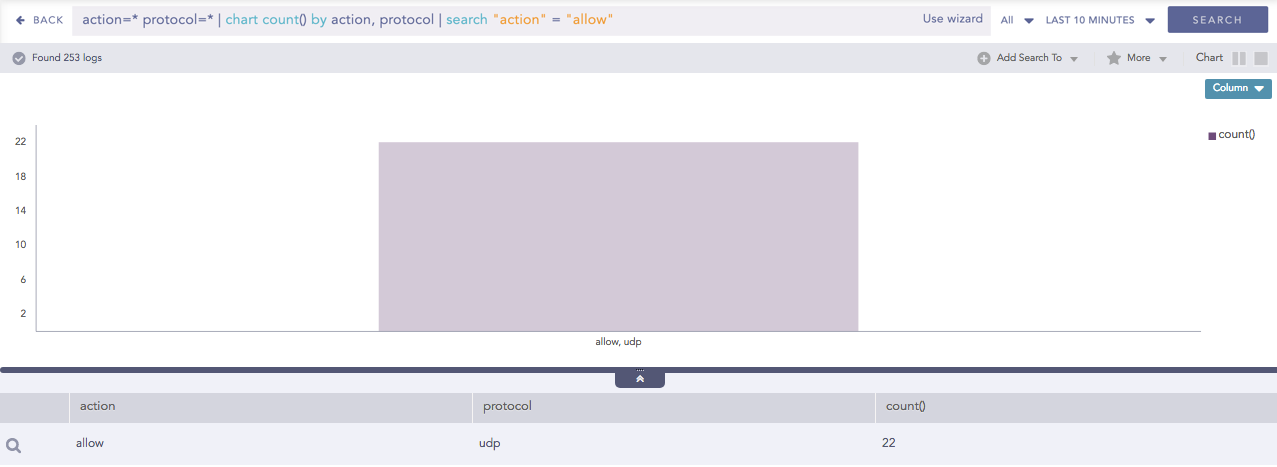
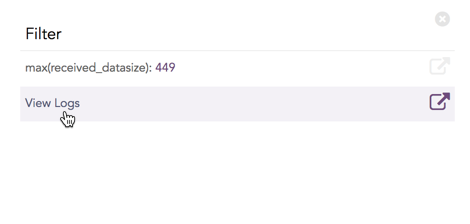
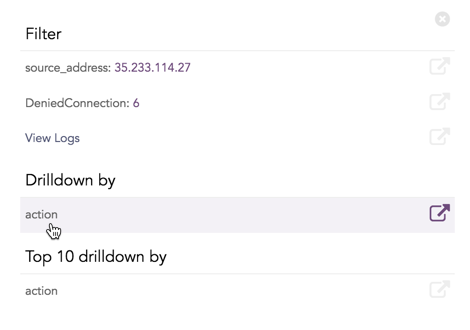
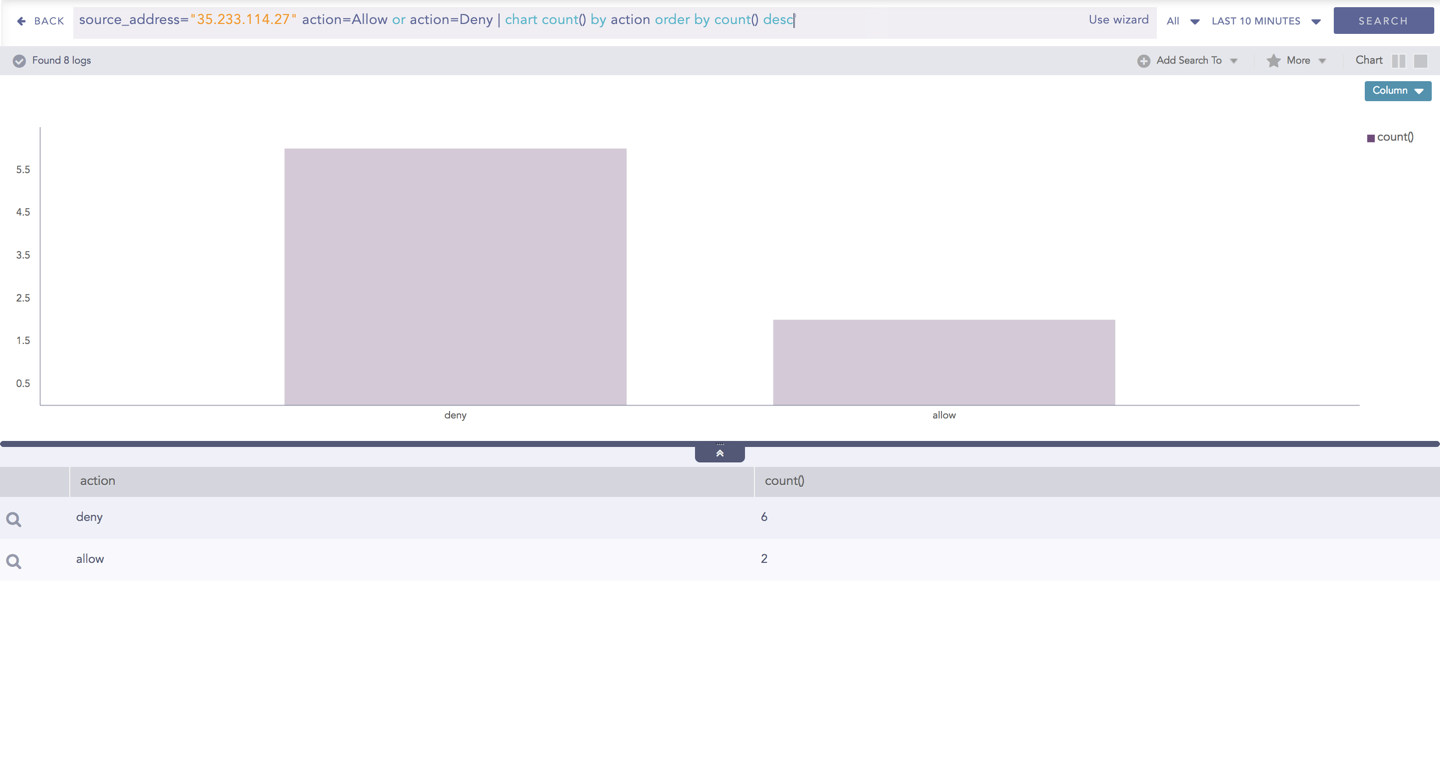
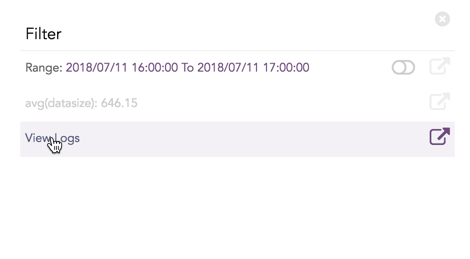
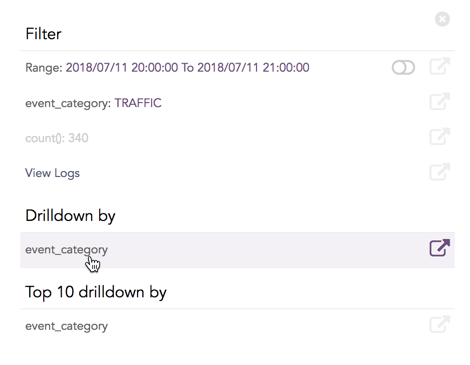
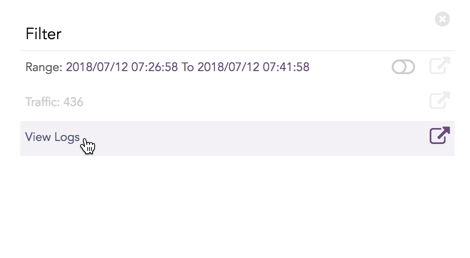
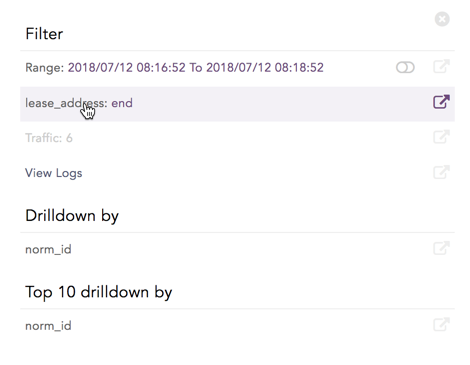
Click the component to open a drill-down window. The window summarizes the related information of the selected section along with the option to drill down as per your preference.
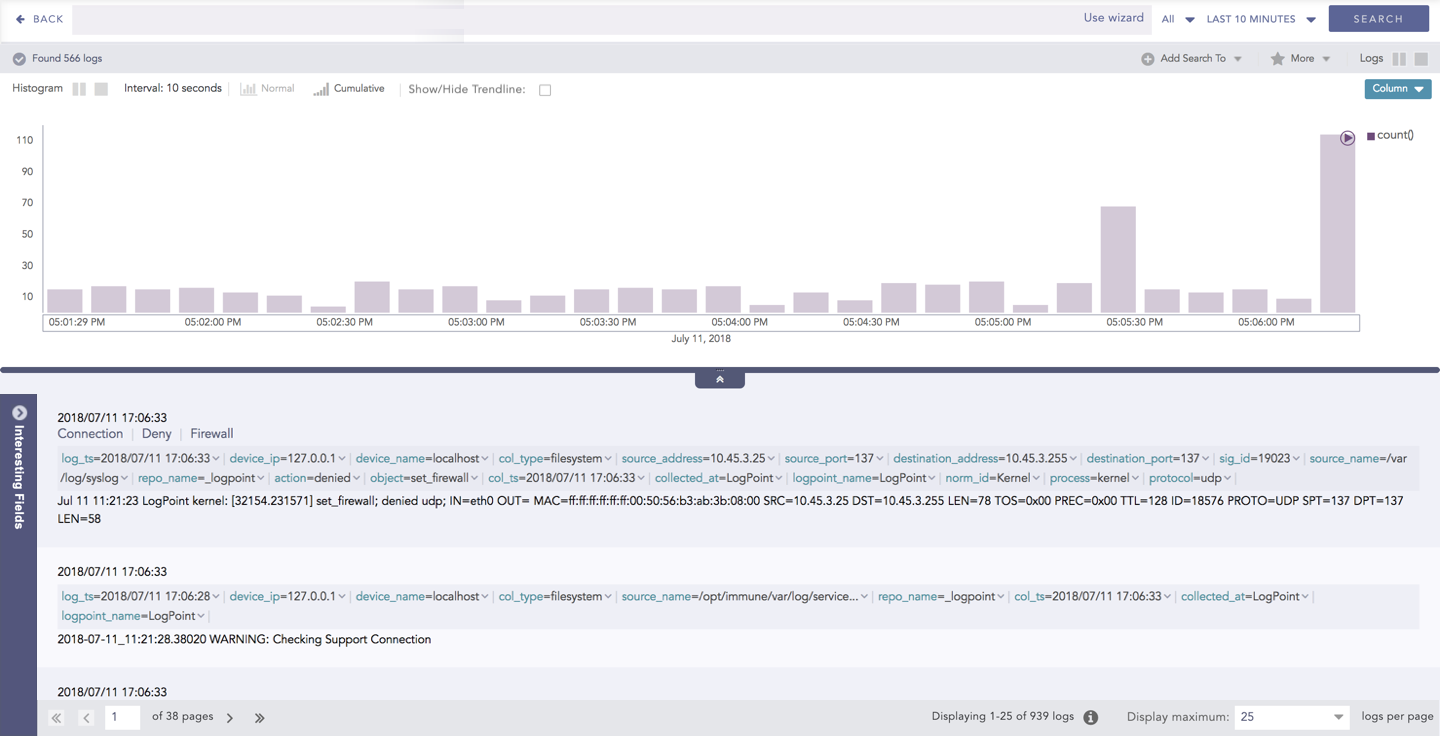
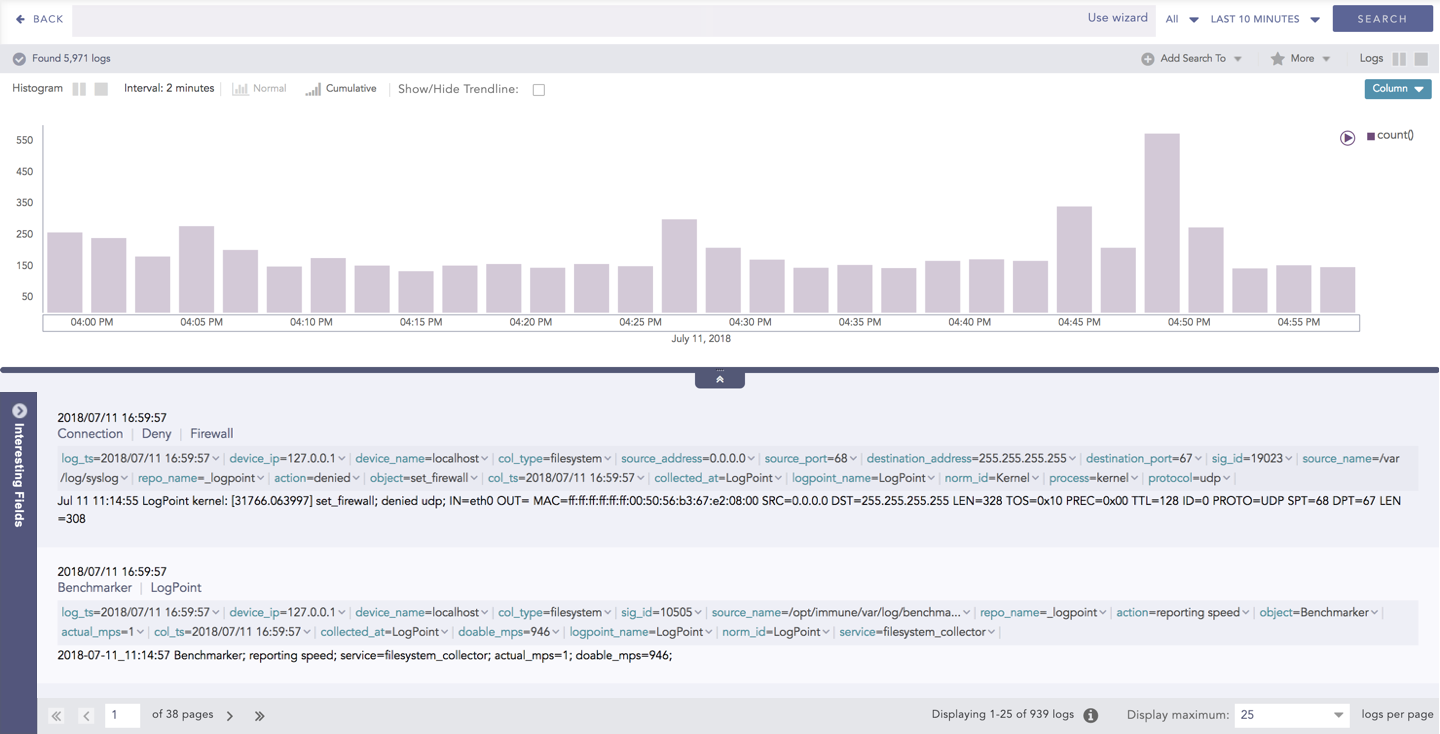
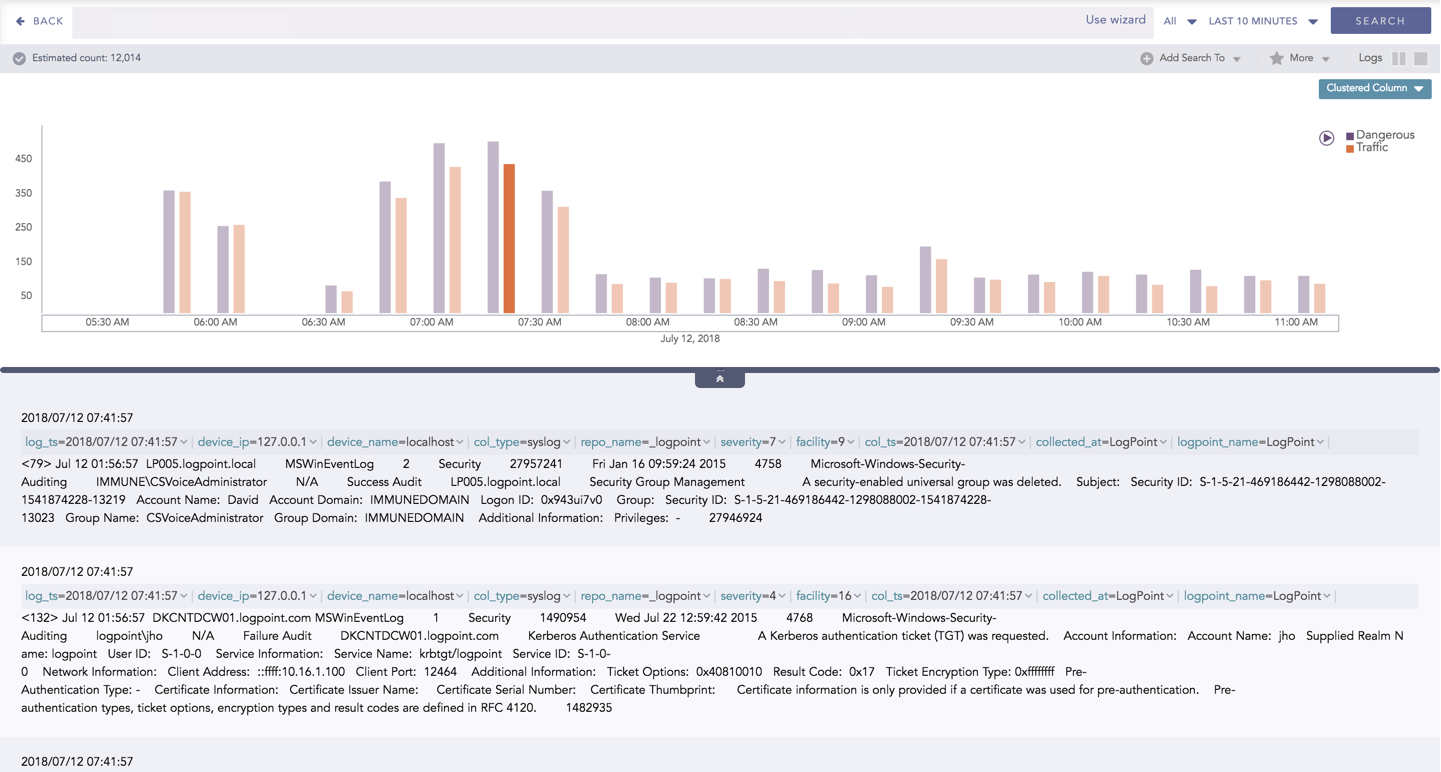
Click the corresponding Open in a new window icon to further drill-down the search result from any field. Additionally, click the View Logs to view the search result for the selected set of data.
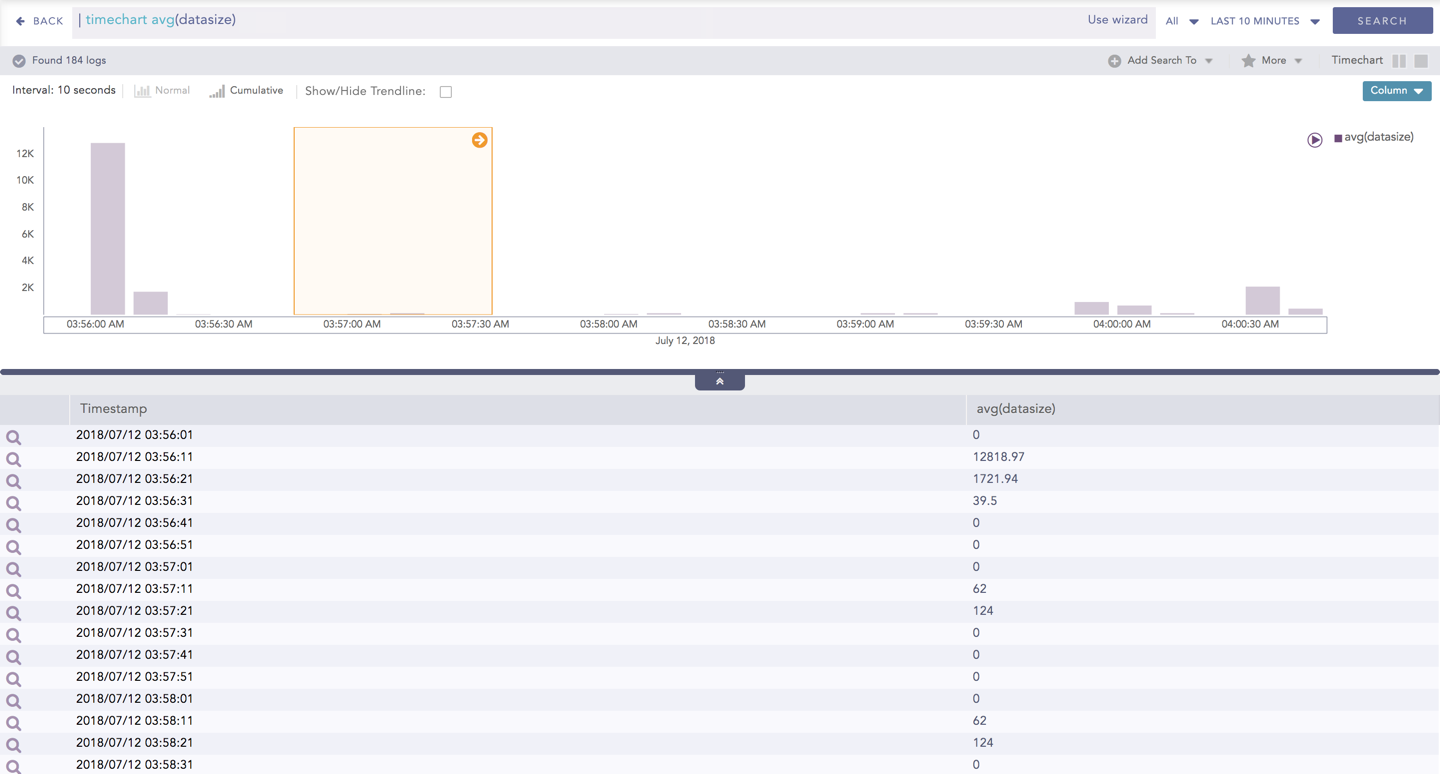
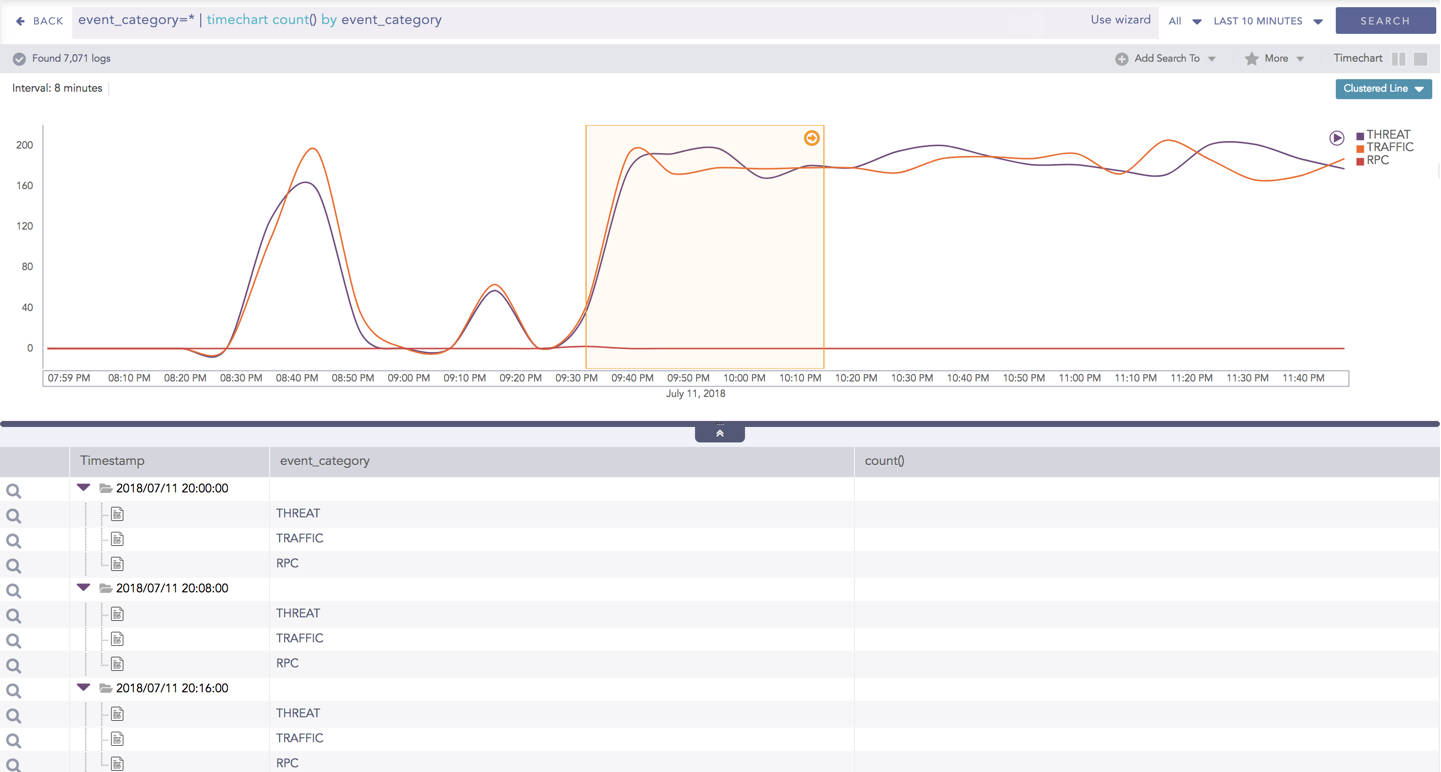
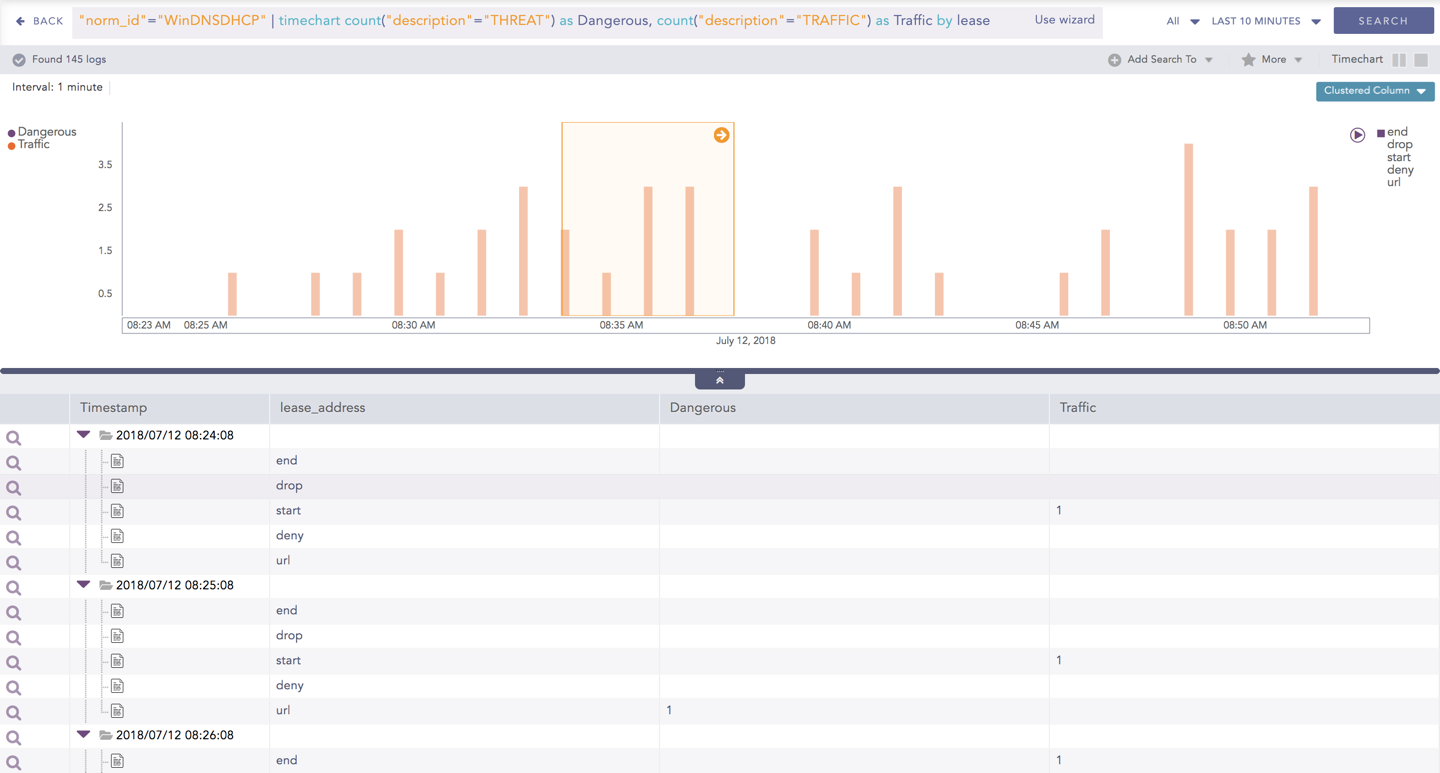
In addition to that, you can also drill-down any chart of the response type using the drag box. Click and drag the mouse inside the graph, a yellow colored transparent drag box appears. You can drill-down the selected section of the chart by clicking the drill-down icon at the top-right corner of the box. You can resize or move the drag box as per your requirement.
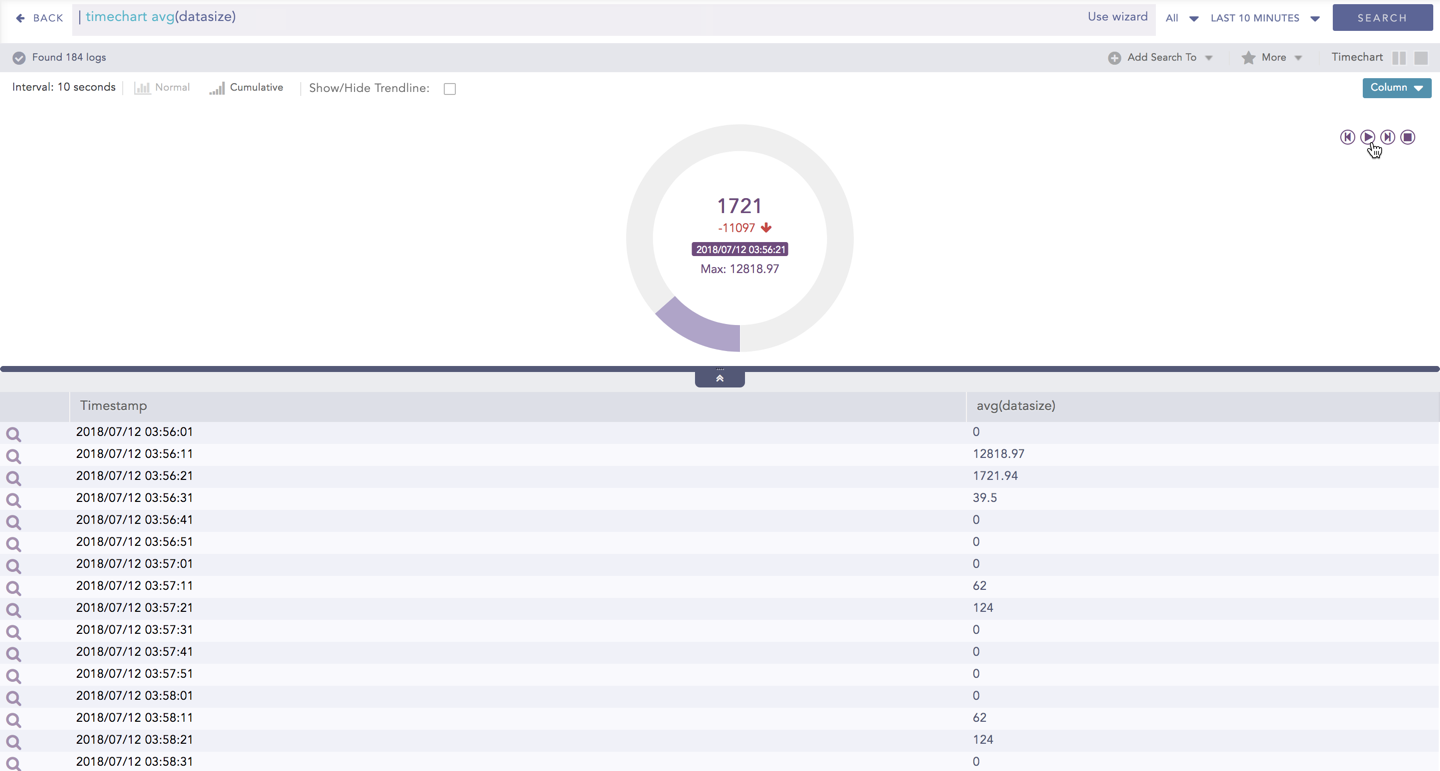
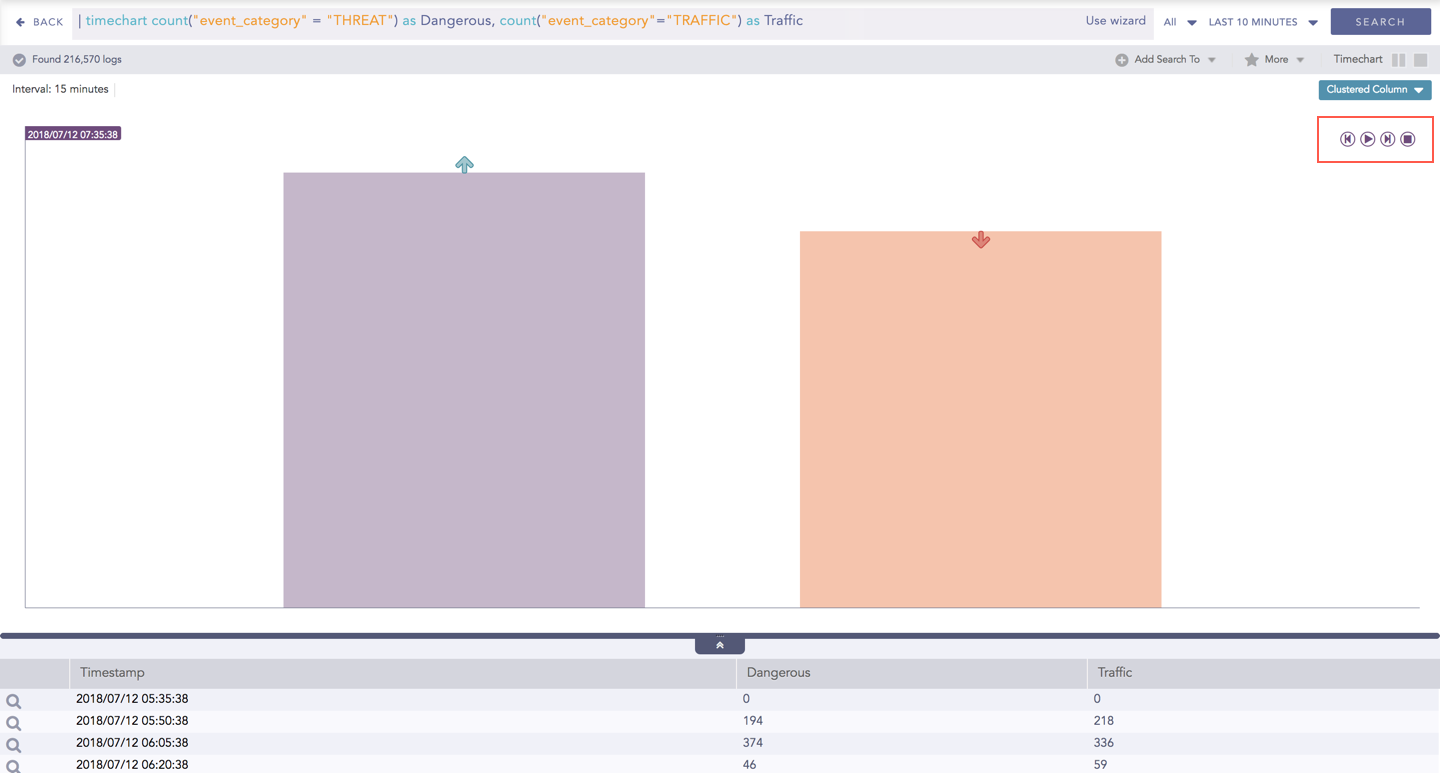
Interactive Animation
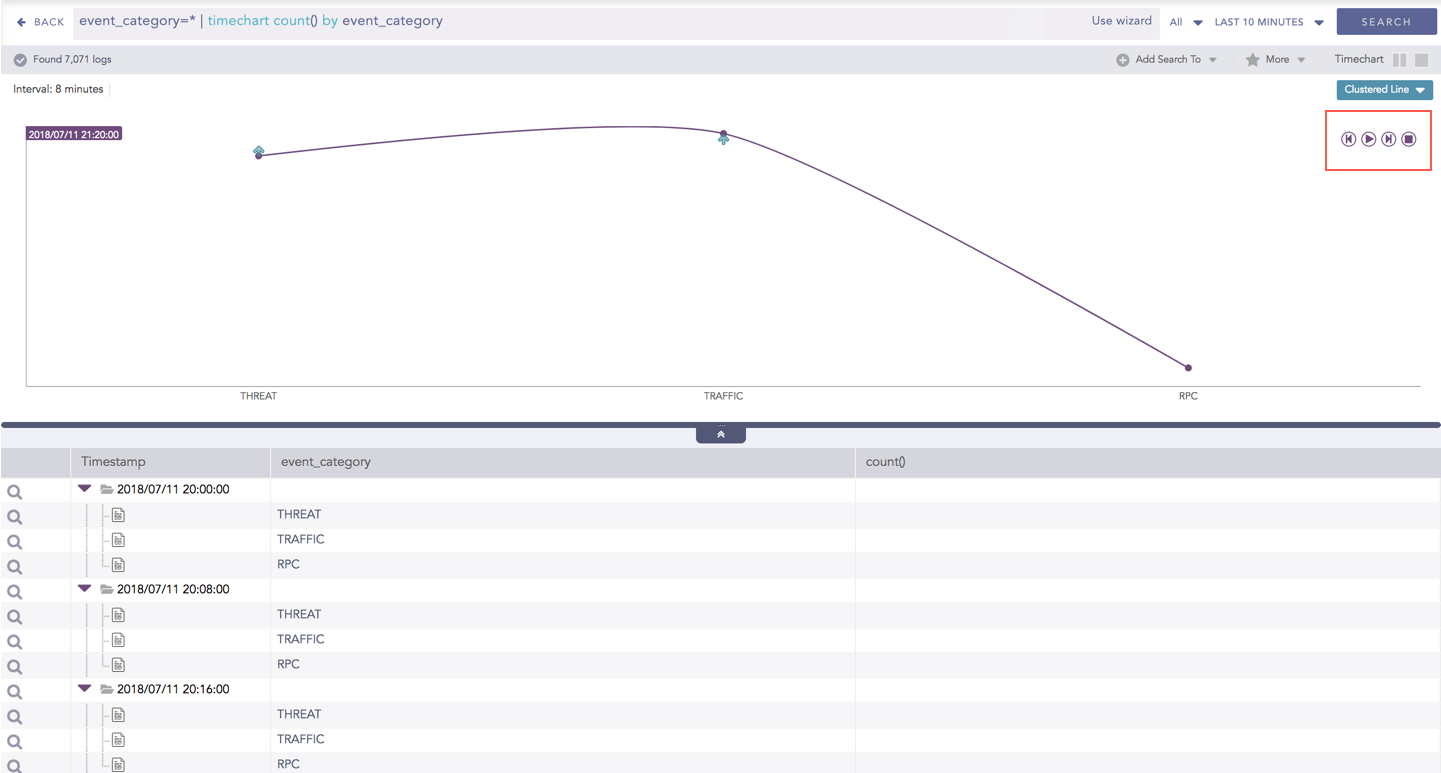
The charts belonging to the Timechart response type include an interactive play button. It allows you to slide through values of the charts concerning time buckets known as Interval.
Click Play on the right side of the container to start the animation. The graph is refreshed every four seconds, i.e., that graph shifts from one time-bucket to another time bucket every four seconds. Value of the time bucket is dependent upon the time-range specified in the Interval.
You can also click Pause, Stop, Previous, Next, Replay as required.